How American Tourism Began
American tourism took the scenic route over the course of the twentieth century. A growing middle class and car ownership helped.

This summer, will you travel to a beach , a national park , or maybe a local campground ? Today, trips like these are often within reach of the average American family. But that’s a relatively new development. In a paper for The Journal of Economic History , Thomas Weiss explains how tourism went from an uncommon pastime for elites to a thoroughly middle-class activity .

Weiss writes that, in general, the first European settlers in America were simply too busy eking out a living to take a vacation. Besides, Puritans and Anglican values discouraged anything even remotely like lying on a beach drinking a margarita. And yet, as early as the 1660s, some Americans were traveling for relaxation, often heading to spas and mineral springs. Among those taking the waters in Virginia a century later was George Washington. Although people claimed the point was to cure an ailment or maintain their health, Weiss writers that spa trips were clearly a “fashionable indulgence.”
In the early nineteenth century, a few scenic destinations became hot spots for tourism, most notably Niagara Falls. In fact, by the 1860s it was so popular that travelers complained that souvenir sellers and aggressive guides had spoiled the place. Still, Weiss estimates that only around 1 percent of the nation’s population visited a spa or other tourist destination in 1860.
Tourism started to become more popular after the Civil War, thanks largely to the development of railroads, though it remained an elite activity. Trains brought travelers to the Jersey Shore and the Florida Coast, and hotels blossomed from Coney Island to San Francisco. Urban Americans headed to the mountains for camping trips, while others explored the restaurants and sights of the major cities. Because transportation was slow and required advance planning, tourists didn’t take quick overnight trips. Vacations meant an extended stay.
That changed in the early twentieth century as cars began populating the landscape. Developers built roadside camps, then cabins and hotels. Small, local attractions popped up everywhere, and major destinations benefited from auto travel. In 1916, around 30,000 visitors traveled to Yellowstone National Park , the majority coming by train. Two decades later, 409,000 people arrived at the park in cars.
By 1930, Weiss writes, more than 5 percent of the population traveled to a well-known tourist attraction each year, and many more clearly stopped at more obscure destinations. The notion of taking vacations had begun to extend into the middle class.

Weekly Digest
Get your fix of JSTOR Daily’s best stories in your inbox each Thursday.
Privacy Policy Contact Us You may unsubscribe at any time by clicking on the provided link on any marketing message.
The basic form of tourism may have been established by World War II, but the scale of the activity changed dramatically in the post-war years. The growth of car ownership, rising middle-class wealth, newly established paid vacation benefits for many workers, and the advent of air travel all contributed to a tourism boom.
And that boom continues today. This year, AAA says a third of Americans will take a family vacation. Of course, that still means two thirds of us won’t. As a recent New York Times story pointed out, many families in the country can’t afford to take time off of work, or to send the kids to a summer camp. To some extent, vacations remain an elite activity.
Read about Ken Ilgunas’s “sort of illegal” hike across the Heartland in “ Backpacking Across ‘Stand Your Ground’ Territory ” on Public Books.
Editor’s note: This page was updated to fix the broken link to “Backpacking Across ‘Stand Your Ground’ Territory.”

JSTOR is a digital library for scholars, researchers, and students. JSTOR Daily readers can access the original research behind our articles for free on JSTOR.
Get Our Newsletter
More stories.

- The Coldest Cream

Wooden Kings and Winds of Change in Tonga

The Impact JSTOR in Prison Has Made on Me

Sex (No!), Drugs (No!), and Rock and Roll (Yes!)
Recent posts.
- Swimming Rediscovered, True Crime, and Zealandia
- The Georgia Peach: A Labor History
- Racial Hierarchies: Japanese American Immigrants in California
- Matilda Tone, Historian of Irish Republicanism
Support JSTOR Daily
Sign up for our weekly newsletter.
ColorWhistle
Digital Web Design Agency India

Explore our Market-Fit Services
We ensure to establish websites with the latest trends as we believe that, products whose value satisfies the needs of the market and its potential customers can be efficiently successful.
Quick Links
- About Us – ColorWhistle
- Engagement Models
- Testimonials
- Case Studies
- Agency Services
- Web Development
- Web App Development
- Digital Marketing
- Travel Website Development Services Company
- Real Estate Website Development Services Company
- Education Website Development Services Company
- Healthcare Website Development Services Company
- Hotel and Restaurant Website Development Services

Category: Travel
Date: May 31, 2024
Evolution of Travel and Tourism Industry
Travel is one of the most important leisure activities in the world. Over the years, the travel industry has changed considerably. It is quite fascinating to see how travel agencies have evolved.
How far have we come? Where did it all start? Take a look at our ultimate travel evolution infographic to learn how the industry keeps moving forward, while evolving, expanding and showcasing more than any other industry.
England and France passed a legislation that required hotels and inns to keep guest registries
Cox & Kings, a travel company was founded
Industrial revolution resulted in expansion of rail infrastructure across Europe and North America
Thomas Cook, an international travel company was founded
The first German travel agency, Reiseburo Rominger was started in Stuttgart
Walter A. Brownell founded Brownell Tours and takes first 10 guests on an archeological tour of Switzerland
American Express Company introduced the world’s first Traveller’s Cheque
The first Indian travel company, Jeena Tours and Travels was established
Travel agencies became a commonplace with the development of commercial aviation
Avis Rent a Car, a car rental company was founded
It took 90 minutes/customer to complete a booking process. So, many airlines began to seriously look for automation tools
American Airlines installed the first automated booking system – the Reservisor
TCA became the first airline in the world to use a CRS with remote terminals
American Airlines switches to an automated airline reservation system known as SABRE
United Airlines introduced the computerized system Apollo based on IBM’s PARS
United Airlines began offering its Apollo system to travel agents
UK based companies launch the world’s first reservation system Travicom
Travicom handled 97% of UK airline business trade bookings
European airlines developed their own GDS system Amadeus
Galileo merged with Apollo system to book airline, hotel, train, cruise and car rental reservation
Navitaire, a technology service provider of the airline and rail industries was founded
Lonely Planet’s website is launched
Microsoft found its own travel booking website Expedia
Travelocity launched as a joint venture of Sabre Interactive and Worldview Systems Corp
HotBot metasearch engine was created
Jay S. Walker founded Priceline.com
Travelzoo, an internet company that publishes travel and leisure deals was founded
OpenTravel Alliance was founded to talk about the disparate systems in the global travel industry
Hotwire, a website that offers airline tickets, hotel rooms, vacation packages etc was established
Skyscanner, a travel fare aggregator website and travel metasearch engine was founded
Orbitz.com a travel fare aggregator website was founded
Couchsurfing international was formed as a New Hampshire nonprofit organization
TripAdvisor was acquired by InterActiveCorp (IAC)
Facebook was launched which inspired many to share their travel experience
IAC spun off its travel group of businesses under the Expedia, Inc. brand
Google Maps, a web mapping service developed by Google was founded
AirBedAndBreakfast (later renamed to Airbnb) was founded
Twitter inspires real-time messaging between travellers and travel brands
Some of the major GDSs are Amadeus, Travelport, Sabre, Shares, Abacus, Travelsky, Infini, Axess and Topas
Google buys IAT, a travel industry software
HotelTonight app was founded. It allowed users to find accommodations in America, Europe and Australia
Google Flights, an online flight booking search service was launched
Kayak Software Corporation was acquired by the Priceline Group
Sabre’s travel itinerary management app is the first travel app to integrate with a smartwatch
Travelocity was acquired by Expedia
WearGeared developed a Museum Glasses prototype application
Amadeus introduces the world’s first Virtual Reality travel search and booking experience
Amadeus launched their new portal Amadeus for developers
Heathrow Airport’s biometrics project is aiming to fully deploy facial recognition for departures
Evolution of travel industry infographics

Drive Conversions and Boost your Business with Expert Travel Website Development.
The travel industry has become a combination of DIY internet tools and travel management companies. Transportation innovations such as trains and airplanes have eliminated the problems and lowered travel costs. In short, it has become possible for travelers to go anywhere on the globe in less than 48 hours.
The market has split into a vast number of nice markets such as ecotourism, backpacking and historical tourism. There has been a handful of trips into orbit around Earth which is branded as ‘space tourism’ which is going to be an exciting chapter in the industry.
We ColorWhistle will keep updating this infographic as and when interesting things happen in the travel industry. Stay tuned!
In quest of the Perfect Travel Tech Solutions Buddy?
Be unrestricted to click the other trendy writes under this title that suits your needs the best!
- Rezdy Online Booking Software Review
- Computer Reservation System
- Online Travel Agencies
- Travel Meta Search Engine
- GDS Travel Agency Guide
- GDS OTA Travel Meta Searchengines
- Travel Aggregator Website
Related Posts

Enhancing Travel Marketing with AI-driven Customer Insights

How Predictive Maintenance Can Help the Travel Industry

Exploring the World Through AI and VR in the Travel Industry
About the Author - Anjana
Anjana is a full-time Copywriter at ColorWhistle managing content-related projects. She writes about website technologies, digital marketing, and industries such as travel. Plus, she has an unhealthy addiction towards online marketing, watching crime shows, and chocolates.
View Our Services
Have an idea? Request a quote
Share This Blog
Your article is really awesome. I would love to read your more blogs. Keep posting.
Hi! Glad that you liked it. We write blogs very frequently. Do check back for more useful information!
Leave a Reply Cancel reply
Your email address will not be published. Required fields are marked *
Ready to get started?
Let’s craft your next digital story

Sure thing, leave us your details and one of our representatives will be happy to call you back!
Eg: John Doe
Eg: United States
Eg: [email protected]
More the details, speeder the process :)
Discussion Schedule: Ready for a GMeet Call Discussion Today / Tomorrow Available on a Phone Call Discussion Today / Tomorrow Send me a Calendar to Book The Meeting

Want to create or adapt books like this? Learn more about how Pressbooks supports open publishing practices.
Chapter 1. History and Overview
Learning Objectives
- Specify the commonly understood definitions of tourism and tourist
- Classify tourism into distinct industry groups using North American Industry Classification Standards (NAICS)
- Define hospitality
- Gain knowledge about the origins of the tourism industry
- Provide an overview of the economic, social, and environmental impacts of tourism worldwide
- Understand the history of tourism development in Canada and British Columbia
- Analyze the value of tourism in Canada and British Columbia
- Identify key industry associations and understand their mandates
What Is Tourism?
Before engaging in a study of tourism , let’s have a closer look at what this term means.
Definition of Tourism
There are a number of ways tourism can be defined, and for this reason, the United Nations World Tourism Organization (UNWTO) embarked on a project from 2005 to 2007 to create a common glossary of terms for tourism. It defines tourism as follows:
Tourism is a social, cultural and economic phenomenon which entails the movement of people to countries or places outside their usual environment for personal or business/professional purposes. These people are called visitors (which may be either tourists or excursionists; residents or non-residents) and tourism has to do with their activities, some of which imply tourism expenditure ( United Nations World Tourism Organization , 2008).
Using this definition, we can see that tourism is the movement of people for a number of purposes (whether business or pleasure).
Definition of Tourist
Building on the definition of tourism, a commonly accepted description of a tourist is “someone who travels at least 80 km from his or her home for at least 24 hours, for business or leisure or other reasons” (LinkBC, 2008, p.8). The United Nations World Tourism Organization (1995) helps us break down this definition further by stating tourists can be:
- Domestic (residents of a given country travelling only within that country)
- Inbound (non-residents travelling in a given country)
- Outbound (residents of one country travelling in another country)
The scope of tourism, therefore, is broad and encompasses a number of activities.
Spotlight On: United Nations World Tourism Organization (UNWTO)
UNWTO is the United Nations agency responsible “for the promotion of responsible, sustainable and universally accessible tourism” (UNWTO, 2014b). Its membership includes 156 countries and over 400 affiliates such as private companies and non-governmental organizations. It promotes tourism as a way of developing communities while encouraging ethical behaviour to mitigate negative impacts. For more information, visit the UNWTO website : http://www2.unwto.org/.
NAICS: The North American Industry Classification System
Given the sheer size of the tourism industry, it can be helpful to break it down into broad industry groups using a common classification system. The North American Industry Classification System (NAICS) was jointly created by the Canadian, US, and Mexican governments to ensure common analysis across all three countries (British Columbia Ministry of Jobs, Tourism and Skills Training, 2013a). The tourism-related groupings created using NAICS are (in alphabetical order):
- Accommodation
- Food and beverage services (commonly known as “F & B”)
- Recreation and entertainment
- Transportation
- Travel services
These industry groups are based on the similarity of the “labour processes and inputs” used for each (Government of Canada, 2013). For instance, the types of employees and resources required to run an accommodation business — whether it be a hotel, motel, or even a campground — are quite similar. All these businesses need staff to check in guests, provide housekeeping, employ maintenance workers, and provide a place for people to sleep. As such, they can be grouped together under the heading of accommodation. The same is true of the other four groupings, and the rest of this text explores these industry groups, and other aspects of tourism, in more detail.
The Hospitality Industry
When looking at tourism it’s important to consider the term hospitality . Some define hospitality as “t he business of helping people to feel welcome and relaxed and to enjoy themselves” (Discover Hospitality, 2015, ¶ 3). Simply put, the hospitality industry is the combination of the accommodation and food and beverage groupings, collectively making up the largest segment of the industry. You’ll learn more about accommodations and F & B in Chapter 3 and Chapter 4, respectively.
Before we seek to understand the five industry groupings in more detail, it’s important to have an overview of the history and impacts of tourism to date.
Global Overview
Origins of tourism.
Travel for leisure purposes has evolved from an experience reserved for very few people into something enjoyed by many. Historically, the ability to travel was reserved for royalty and the upper classes. From ancient Roman times through to the 17th century, young men of high standing were encouraged to travel through Europe on a “grand tour” (Chaney, 2000). Through the Middle Ages, many societies encouraged the practice of religious pilgrimage, as reflected in Chaucer’s Canterbury Tales and other literature.
The word hospitality predates the use of the word tourism , and first appeared in the 14th century. It is derived from the Latin hospes , which encompasses the words guest, host , and foreigner (Latdict, 2014). The word tourist appeared in print much later, in 1772 (Griffiths and Griffiths, 1772). William Theobald suggests that the word tour comes from Greek and Latin words for circle and turn, and that tourism and tourist represent the activities of circling away from home, and then returning (Theobald, 1998).
Tourism Becomes Business
Cox & Kings, the first known travel agency, was founded in 1758 when Richard Cox became official travel agent of the British Royal Armed Forces (Cox & Kings, 2014). Almost 100 years later, in June 1841, Thomas Cook opened the first leisure travel agency, designed to help Britons improve their lives by seeing the world and participating in the temperance movement. In 1845, he ran his first commercial packaged tour, complete with cost-effective railway tickets and a printed guide (Thomas Cook, 2014).
The continued popularity of rail travel and the emergence of the automobile presented additional milestones in the development of tourism. In fact, a long journey taken by Karl Benz’s wife in 1886 served to kick off interest in auto travel and helped to publicize his budding car company, which would one day become Mercedes Benz (Auer, 2006). We take a closer look at the importance of car travel later this chapter, and of transportation to the tourism industry in Chapter 2.
Fast forward to 1952 with the first commercial air flights from London, England, to Johannesburg, South Africa, and Colombo, Sri Lanka (Flightglobal, 2002) and the dawn of the jet age, which many herald as the start of the modern tourism industry. The 1950s also saw the creation of Club Méditérannée (Gyr, 2010) and similar club holiday destinations, the precursor of today’s all-inclusive resorts.
The decade that followed is considered to have been a significant period in tourism development, as more travel companies came onto the scene, increasing competition for customers and moving toward “mass tourism, introducing new destinations and modes of holidaying” (Gyr, 2010, p. 32).
Industry growth has been interrupted at several key points in history, including World War I, the Great Depression, and World War II. At the start of this century, global events thrust international travel into decline including the September 11, 2001, attack on the World Trade Center in New York City (known as 9/11), the war in Iraq, perceived threat of future terrorist attacks, and health scares including SARS, BSE (bovine spongiform encephalopathy), and West Nile virus (Government of Canada, 2006).
At the same time, the industry began a massive technological shift as increased internet use revolutionized travel services. Through the 2000s, online travel bookings grew exponentially, and by 2014 global leader Expedia had expanded to include brands such as Hotels.com, the Hotwire Group, trivago, and Expedia CruiseShip Centers, earning revenues of over $4.7 million (Expedia Inc., 2013).
A more in-depth exploration of the impact of the online marketplace, and other trends in global tourism, is provided in Chapter 14. But as you can already see, the impacts of the global tourism industry today are impressive and far reaching. Let’s have a closer look at some of these outcomes.
Tourism Impacts
Tourism impacts can be grouped into three main categories: economic, social, and environmental. These impacts are analyzed using data gathered by businesses, governments, and industry organizations.
Economic Impacts
According to a UNWTO report, in 2011, “international tourism receipts exceeded US$1 trillion for the first time” (UNWTO, 2012). UNWTO Secretary-General Taleb Rifai stated this excess of $1 trillion was especially important news given the global economic crisis of 2008, as tourism could help rebuild still-struggling economies, because it is a key export and labour intensive (UNWTO, 2012).

Tourism around the world is now worth over $1 trillion annually, and it’s a growing industry almost everywhere. Regions with the highest growth in terms of tourism dollars earned are the Americas, Europe, Asia and the Pacific, and Africa. Only the Middle East posted negative growth at the time of the report (UNWTO, 2012).
While North and South America are growing the fastest, Europe continues to lead the way in terms of overall percentage of dollars earned (UNWTO, 2012):
- Europe (45%)
- Asia and the Pacific (28%)
- North and South America (19%)
- Middle East (4%)
Global industry growth and high receipts are expected to continue. In its August 2014 expenditure barometer, the UNWTO found worldwide visitation had increased by 22 million people in the first half of the year over the previous year, to reach 517 million visits (UNWTO, 2014a). As well, the UNWTO’s Tourism 2020 Vision predicts that international arrivals will reach nearly 1.6 billion by 2020 . Read more about the Tourism 2020 Vision : http://www.e-unwto.org/doi/abs/10.18111/9789284403394
Social Impacts
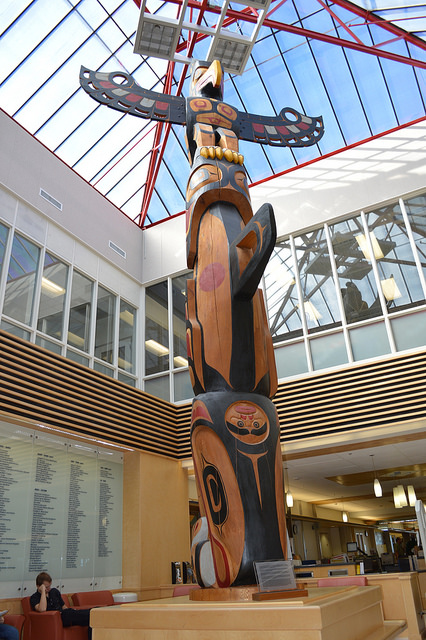
In addition to the economic benefits of tourism development, positive social impacts include an increase in amenities (e.g., parks, recreation facilities), investment in arts and culture, celebration of First Nations people, and community pride. When developed conscientiously, tourism can, and does, contribute to a positive quality of life for residents.
However, as identified by the United Nations Environment Programme (UNEP, 2003a), negative social impacts of tourism can include:
- Change or loss of indigenous identity and values
- Culture clashes
- Physical causes of social stress (increased demand for resources)
- Ethical issues (such as an increase in sex tourism or the exploitation of child workers)
Some of these issues are explored in further detail in Chapter 12, which examines the development of Aboriginal tourism in British Columbia.
Environmental Impacts
Tourism relies on, and greatly impacts, the natural environment in which it operates. Even though many areas of the world are conserved in the form of parks and protected areas, tourism development can have severe negative impacts. According to UNEP (2003b), these can include:
- Depletion of natural resources (water, forests, etc.)
- Pollution (air pollution, noise, sewage, waste and littering)
- Physical impacts (construction activities, marina development, trampling, loss of biodiversity)
The environmental impacts of tourism can reach outside local areas and have an effect on the global ecosystem. One example is increased air travel, which is a major contributor to climate change. Chapter 10 looks at the environmental impacts of tourism in more detail.
Whether positive or negative, tourism is a force for change around the world, and the industry is transforming at a staggering rate. But before we delve deeper into our understanding of tourism, let’s take a look at the development of the sector in our own backyard.
Canada Overview
Origins of tourism in canada.
Tourism has long been a source of economic development for our country. Some argue that as early as 1534 the explorers of the day, such as Jacques Cartier, were Canada’s first tourists (Dawson, 2004), but most agree the major developments in Canada’s tourism industry followed milestones in the transportation sector: by rail, by car, and eventually, in the skies.
Railway Travel: The Ties That Bind

The dawn of the railway age in Canada came midway through the 19th century. The first railway was launched in 1836 (Library and Archives Canada, n.d.), and by the onset of World War I in 1914, four railways dominated the Canadian landscape: Canadian Pacific Railway (CPR), Canadian Northern Railway (CNOR), the Grand Trunk Railway (GTR), and the Grand Trunk Pacific (GTP). Unfortunately, their rapid expansion soon brought the last three into near bankruptcy (Library and Archives Canada, n.d.).
In 1923, these three rail companies were amalgamated into the Canadian National Railway (CNR), and together with the CPR, these trans-continentals dominated the Canadian travel landscape until other forms of transportation became more popular. In 1978, with declining interest in rail travel, the CPR and CNR were forced to combine their passenger services to form VIA Rail (Library and Archives Canada, n.d.).
The Rise of the Automobile
The rising popularity of car travel was partially to blame for the decline in rail travel, although it took time to develop. When the first cross-country road trip took place in 1912, there were only 16 kilometres of paved road across Canada (MacEachern, 2012). Cars were initially considered a nuisance, and the National Parks Branch banned entry to automobiles, but later slowly began to embrace them. By the 1930s, some parks, such as Cape Breton Highlands National Park, were actually created to provide visitors with scenic drives (MacEachern, 2012).
It would take decades before a coast-to-coast highway was created, with the Trans-Canada Highway officially opening in Revelstoke in 1962. When it was fully completed in 1970, it was the longest national highway in the world, spanning one-fifth of the globe (MacEachern, 2012).
Early Tourism Promotion
As early as 1892, enterprising Canadians like the Brewsters became the country’s first tour operators, leading guests through areas such as Banff National Park (Brewster Travel Canada, 2014). Communities across Canada developed their own marketing strategies as transportation development took hold. For instance, the town of Maisonneuve in Quebec launched a campaign from 1907 to 1915 calling itself “Le Pittsburg du Canada.” And by 1935 Quebec was spending $250,000 promoting tourism, with Ontario, New Brunswick, and Nova Scotia also enjoying established provincial tourism bureaus (Dawson, 2004).
National Airlines
Our national airline, Air Canada, was formed in 1937 as Trans-Canada Air Lines. In many ways, Air Canada was a world leader in passenger aviation, introducing the world’s first computerized reservations system in 1963 ( Globe and Mail , 2014). Through the 1950s and 1960s, reduced airfares saw increased mass travel. Competitors including Canadian Pacific (which became Canadian Airlines in 1987) began to launch international flights during this time to Australia, Japan, and South America ( Canadian Geographic, 2000). By 2000, Air Canada was facing financial peril and forced to restructure. A numbered company, owned in part by Air Canada, purchased 82% of Canadian Airline’s shares, with the result of Air Canada becoming the country’s only national airline ( Canadian Geographic, 2000).
Parks and Protected Areas
A look at the evolution of tourism in Canada would be incomplete without a quick study of our national parks and protected areas. The official conserving of our natural spaces began around the same time as the railway boom, and in 1885 Banff was established as Canada’s first national park. By 1911, the Dominion Forest Reserves and Parks Act created the Dominion Parks Branch, the first of its kind in the world (Shoalts, 2011).
The systemic conservation and celebration of Canada’s parks over the next century would help shape Canada’s identity, both at home and abroad. Through the 1930s, conservation officers and interpreters were hired to enhance visitor experiences. By 1970, the National Park System Plan divided Canada into 39 regions, with the goal of preserving each distinct ecosystem for future generations. In 1987, the country’s first national marine park was established in Ontario, and in the 20 years that followed, 10 new national parks and marine conservation areas were created (Shoalts, 2011).
The role of parks and protected areas in tourism is explored in greater detail in Chapter 5 (recreation) and Chapter 10 (environmental stewardship).
Global Shock and Industry Decline
As with the global industry, Canada’s tourism industry was impacted by world events such as the Great Depression and the World Wars.
More recently, global events such as 9/11, the SARS outbreak, and the war in Iraq took their toll on tourism receipts. Worldwide arrivals to Canada dropped 1% to 694 million in 2003, after three years of stagnant growth. In 2005, spending reached $61.4 billion with domestic travel accounting for 71% (Government of Canada, 2006).
Tourism in Canada Today
In 2011, tourism created $78.8 billion in total economic activity and 603,400 jobs. Tourism accounted for more of Canada’s gross domestic product (GDP) than agriculture, forestry, and fisheries combined (Tourism Industry Association of Canada, 2014).
Spotlight On: The Tourism Industry Association of Canada (TIAC)
Founded in 1930 and based in Ottawa, the Tourism Industry Association of Canada (TIAC) is the national private-sector advocate for the industry. Its goal is to support policies and programs that help the industry grow, while representing over 400 members including airports, concert halls, festivals and events, travel services providers, and businesses of all sizes. For more information, visit the Tourism Industry Association of Canada’s website : http://tiac.travel/About.html
Unfortunately, while overall receipts from tourism appear healthy, and globally the industry is growing, according to a recent report, Canada’s historic reliance on the US market (which traditionally accounts for 75% of our market) is troubling. Because three out of every four international visitors to Canada originates in the United States, the 55% decline in that market since 2000 is being very strongly felt here. Many feel the decline in American visitors to Canada can be attributed to tighter passport and border regulations, the economic downturn (including the 2008 global economic crisis), and a stronger Canadian dollar (TIAC, 2014).
Despite disappointing numbers from the United States, Canada continues to see strong visitation from the United Kingdom, France, Germany, Australia, and China. In 2011, we welcomed 3,180,262 tourists from our top 15 inbound countries (excluding the United States). Canadians travelling domestically accounted for 80% of tourism revenues in the country, and TIAC suggested that a focus on rebounding US visitation would help grow the industry (TIAC, 2014).
Spotlight On: The Canadian Tourism Commission
Housed in Vancouver, Destination Canada , previously the Canadian Tourism Commission (CTC), is responsible for promoting Canada in several foreign markets: Australia, Brazil, China, France, Germany, India, Japan, Mexico, South Korea, the United Kingdom, and the United States. It works with private companies, travel services providers, meeting professionals, and government organizations to help leverage Canada’s tourism brand, Canada. Keep Exploring . It also conducts research and has a significant image library (Canadian Tourism Commission, 2014). For more information, visit Destination Canada website : http://en.destinationcanada.com/about-ctc.
As organizations like TIAC work to confront barriers to travel, the Canadian Tourism Commission (CTC) is active abroad, encouraging more visitors to explore our country. In Chapter 8, we’ll delve more into the challenges and triumphs of selling tourism at home and abroad.
The great news for British Columbia is that once in Canada, most international visitors tend to remain in the province they landed in, and BC is one of three provinces that receives the bulk of this traffic (TIAC, 2012). In fact, BC’s tourism industry is one of the healthiest in Canada today. Let’s have a look at how our provincial industry was established and where it stands now.
British Columbia Overview
Origins of tourism in bc.
As with the history of tourism in Canada, it’s often stated that the first tourists to BC were explorers. In 1778, Captain James Cook touched down on Vancouver Island, followed by James Douglas in 1842, a British agent who had been sent to find new headquarters for the Hudson’s Bay Company, ultimately choosing Victoria. Through the 1860s, BC’s gold rush attracted prospectors from around the world, with towns and economies springing up along the trail (PricewaterhouseCoopers, 2009).
Railway Travel: Full Steam Ahead!
The development of BC’s tourism industry began in earnest in the late 1800s when the CPR built accommodation properties along itsnewly completed trans-Canada route, capturing revenues from overnight stays to help alleviate their increasing corporate debt. Following the 1886 construction of small lodges at stops in Field, Rogers Pass, and Fraser Canyon, the CPR opened the Hotel Vancouver in May 1887 (Dawson, 2004).
As opposed to Atlantic Canada, where tourism promotion centred around attracting hunters and fishermen for a temporary infusion of cash, in British Columbia tourism was seen as a way to lure farmers and settlers to stay in the new province. Industry associations began to form quickly: the Tourist Association of Victoria (TAV) in February 1902, and the Vancouver Tourist Association in June of the same year (Dawson, 2004).
Many of the campaigns struck by these and other organizations between 1890 and 1930 centred on the province’s natural assets, as people sought to escape modern convenience and enjoy the environment. A collaborative group called the Pacific Northwest Travel Association (BC, Washington, and Oregon) promoted “The Pacific Northwest: The World’s Greatest Out of Doors,” calling BC “The Switzerland of North America.” Promotions like these seemed to have had an effect: in 1928, over 370,000 tourists visited Victoria, spending over $3.5 million (Dawson, 2004).
The Great Depression and World War II
As the world’s economy was sent into peril during the Great Depression in the 1930s, tourism was seen as an economic solution. A newly renamed Greater Victoria Publicity Bureau touted a “100 for 1” multiplier effect of tourism spending, with visitor revenues accounting for around 13.5% of BC’s income in 1930. By 1935, an organization known as the TTDA (Tourist Trade Development Association of Victoria and Vancouver Island) looked to create a more stable industry through strategies to increase visitors’ length of stay (Dawson, 2004).
In 1937, the provincial Bureau of Industrial and Tourist Development (BITD) was formed through special legislation with a goal of increasing tourist traffic. By 1938, the organization changed its name to the British Columbia Government Travel Bureau (BCGTB) and was granted a budget increase to $105,000. This was soon followed by an expansion of the BC Tourist Council designed to solicit input from across the province. And in 1939, Vancouver welcomed the King and Queen of England and celebrated the opening of the Lions Gate Bridge, activities that reportedly bolstered tourism numbers (Dawson, 2004).
The December 1941 Japanese attack on Pearl Harbor in Hawaii had negative repercussions for tourism on the Pacific Rim and was responsible for an era of decreased visitation to British Columbia, despite attempts by some to market the region as exciting. From 1939 to 1943, US visits to Vancouver (measured at the border) dropped from over 307,000 to approximately 183,600. Just two years later, however, that number jumped to 369,250, the result of campaigns like the 1943 initiative aimed at Americans that marketed BC as “comrades in war” (Dawson, 2004).
Post-War Rebound
We, with all due modesty, cannot help but claim that we are entering British Columbia’s half-century, and cannot help but observe that B.C. also stands for BOOM COUNTRY. – Phil Gagliardi, BC Minister of Highways, 1955 (Dawson, 2004, p.190)
A burst of post-war spending began in 1946, and although short-lived, was supported by steady government investment in marketing throughout the 1950s. As tourism grew in BC, however, so did competition for US dollars from Mexico, the Caribbean, and Europe. The decade that followed saw an emphasis on promoting BC’s history, its “Britishness,” and a commodification of Aboriginal culture. The BCGTB began marketing efforts to extend the travel season, encouraging travel in September, prime fishing season. It also tried to push visitors to specific areas, including the Lower Fraser Valley, the Okanagan-Fraser Canyon Loop, and the Kamloops-Cariboo region (Dawson, 2004).

In 1954, Vancouver hosted the British Empire Games, investing in the construction of Empire Stadium. A few years later, an increased emphasis on events and convention business saw the Greater Vancouver Tourist Association change its name in 1962 to the Greater Vancouver Visitors and Convention Bureau (PricewaterhouseCoopers, 2009).
The ski industry was also on the rise: in 1961, the lodge and chairlift on Tod Mountain (now Sun Peaks) opened, and Whistler followed suit five years later (PricewaterhouseCoopers, 2009). Ski partners became pioneers of collaborative marketing in the province with the foundation of the Ski Marketing Advisory Committee (SMAC) supported by Tod Mountain and Big White, evolving into today’s Canada’s West Ski Area Association (Magnes, 2010). This pioneer spirit was evident across the ski sector: the entire sport of heliskiing was invented by Hans Gosmer of BC’s Canadian Mountain Holidays, and today the province holds 90% of the world’s heliskiing market share (McLeish, 2014).
The concept of collaboration extended throughout the province as innovative funding structures saw the cost of marketing programs shared between government and industry in BC. These programs were distributed through regional channels (originally eight regions in the province), and considered “the most constructive and forward looking plan of its kind in Canada” (Dawson 2004, p.194).
Tourism in BC continued to grow through the 1970s. In 1971, the Hotel Room Tax Act was introduced, allowing for a 5% tax to be collected on room nights with the funds collected to be put toward marketing and development. By 1978, construction had begun on Whistler Village, with Blackcomb Mountain opening two years later (PricewaterhouseCoopers, 2009). Funding programs in the late 1970s and early 1980s such as the Canada BC Tourism Agreement (CBCTA) and Travel Industry Development Subsidiary Agreement (TIDSA) allowed communities to invest in projects that would make them more attractive tourism destinations. In the mountain community of Kimberley, for instance, the following improvements were implemented through a $3.1 million forgivable loan: a new road to the ski resort, a covered tennis court, a mountain lodge, an alpine slide, and nine more holes for the golf course (e-Know, 2011).
Around the same time, the “Super, Natural British Columbia” brand was introduced, and a formal bid was approved for Vancouver to host a fair then known as Transpo 86 (later Expo 86). Tourism in the province was about to truly take off.
Expo 86 and Beyond
By the time the world fair Expo 86 came to a close in October 1986, it had played host to 20,111,578 guests. Infrastructure developments, including rapid rail, airport improvements, a new trade and convention centre at Canada Place (with a cruise ship terminal), and hotel construction, had positioned the city and the province for further growth (PricewaterhouseCooopers, 2009). The construction and opening of the Coquihalla Highway through to 1990 enhanced the travel experience and reduced travel times to vast sections of the province (Magnes, 2010).
Take a Closer Look: The Value of Tourism
Tourism Vancouver Island, with the support of many partners, has created a website that directly addresses the value of tourism in the region. The site looks at the economics of tourism, social benefits of tourism, and a “what’s your role?” feature that helps users understand where they fit in. Explore the Tourism Vancouver Island website : http://valueoftourism.ca/.
By 2000, Vancouver International Airport (YVR) was named number one in the world by the International Air Transport Association’s survey of international passengers. Five years later, the airport welcomed a record 16.4 million passengers (PricewaterhouseCoopers, 2009).
Going for Gold

In 2003, the International Olympic Committee named Vancouver/Whistler as the host city for the 2010 Olympic and Paralympic Winter Games. Infrastructure development followed, including the expansion of the Sea-to-Sky Highway, the creation of Vancouver Convention Centre West, and the construction of the Canada Line, a rapid transport line connecting the airport with the city’s downtown.
As BC prepared to host the Games, its international reputation continued to grow. Vancouver was voted “Best City in the Americas” by Condé Nast Traveller magazine three years in a row. Kelowna was named “Best Canadian Golf City” by Canada’s largest golf magazine, and BC was named the “Best Golf Destination in North America” by the International Association of Golf Tour Operators. Kamloops, known as Canada’s Tournament City, hosted over 100 sports tournaments that same year, and nearby Sun Peaks Resort was named the “Best Family Resort in North America” by the Great Skiing and Snowboarding Guide in 2008 (PricewaterhouseCoopers, 2009).
By the time the Vancouver 2010 Olympic and Paralympic Games took place, over 80 participating countries, 6,000 athletes, and 3 billion viewers put British Columbia on centre stage.
Spotlight On: Destination British Columbia
Destination BC is a Crown corporation founded in November 2012 by the Government of British Columbia. Its mandate includes marketing the province as a tourist destination (at home and around the world), promoting the development and growth of the industry, providing advice and recommendations to the tourism minister on related matters, and enhancing public awareness of tourism and its economic value to British Columbia (Province of British Columbia, 2013b).
Tourism in BC Today
Building on the momentum generated by hosting the 2010 Winter Olympic Games, tourism in BC remains big business. In 2012, the industry generated $13.5 billion in revenue.
The provincial industry is made up of over 18,000 businesses, the majority of which are SMEs (small to medium enterprises), and together they employ approximately 127,300 people (Tourism Industry Association of BC, 2014). It may surprise you to learn that in British Columbia, tourism provides more jobs than high tech, oil and gas, mining, and forestry (Porges, 2014).
Spotlight On: The Tourism Industry Association of BC
Founded in 1993 as the Council of Tourism Associations, today the Tourism Industry Association of BC (TIABC) is a not-for-profit trade association comprising members from private sector tourism businesses, industry associations, and destination marketing organizations (DMOs). Its goal is to ensure the best working environment for a competitive tourism industry. It hosts industry networking events and engages in advocacy efforts as “the voice of the BC tourism industry.” Students are encouraged to join TIABC to take advantage of their connections and receive a discount at numerous industry events. For more information, visit the Tourism Industry Association of BC’s website : http://www.tiabc.ca/student-membership
One of the challenges for BC’s tourism industry, it has long been argued, is fragmentation. Back in September 1933, an article in the Victoria Daily Times argued for more coordination across organizations in order to capitalize on what they saw as Canada’s “largest dividend payer” (Dawson, 2004). Today, more than 80 years later, you will often hear BC tourism professionals say the same thing.
On the other hand, some experts believe that the industry is simply a model of diversity, acknowledging that tourism is a compilation of a multitude of businesses, services, organizations, and communities. They see the ways in which these components are working together toward success, rather than focusing on friction between the groups.
Many communities are placing a renewed focus on educating the general public and other businesses about the value of tourism and the ways in which stakeholders work together. The following case study highlights this in more detail:
Take a Closer Look: Tourism Pays in Richmond, BC
The community of Richmond, BC, brings to life the far-reaching positive economic effects of tourism in action. Watch the short video called “Tourism Pays” to see what we mean!: http://vimeo.com/31624689

Throughout the rest of this textbook, you’ll have a chance to learn more about the history and current outlook for tourism in BC, with in-depth coverage of some of the triumphs and challenges we’ve faced as an industry. You will also learn about the Canadian and global contexts of the tourism industry’s development.
As we’ve seen in this chapter, tourism is a complex set of industries including accommodation, recreation and entertainment, food and beverage services, transportation, and travel services. It encompasses domestic, inbound, and outbound travel for business, leisure, or other purposes. And because of this large scope, tourism development requires participation from all walks of life, including private business, governmental agencies, educational institutions, communities, and citizens.
Recognizing the diverse nature of the industry and the significant contributions tourism makes toward economic and social value for British Columbians is important. There remains a great deal of work to better educate members of the tourism industry, other sectors, and the public about the ways tourism contributes to our province.
Given this opportunity for greater awareness, it is hoped that students like you will help share this information as you learn more about the sector. So let’s begin our exploration in Chapter 2 with a closer look at a critical sector: transportation.
- British Columbia Government Travel Bureau ( BCGTB) : the first recognized provincial government organization responsible for the tourism marketing of British Columbia
- Canadian Pacific Railway (CPR) : a national railway company widely regarded as establishing tourism in Canada and BC in the late 1800s and early 1900s
- Destination BC: the provincial destination marketing organization (DMO) responsible for tourism marketing and development in BC, formerly known as Tourism BC
- Destination Canada: the national government Crown corporation responsible for marketing Canada abroad, formerly known as the Canadian Tourism Commission (CTC)
- Destination marketing organization (DMO): also known as a destination management organization; includes national tourism boards, state/provincial tourism offices, and community convention and visitor bureaus
- Diversity: a term used by some in the industry to describe the makeup of the industry in a positive way; acknowledging that tourism is a diverse compilation of a multitude of businesses, services, organizations, and communities
- Fragmentation: a phenomenon observed by some industry insiders whereby the tourism industry is unable to work together toward common marketing and lobbying (policy-setting) objectives
- Hospitality: the accommodations and food and beverage industry groupings
- North American Industry Classification System (NAICS) : a way to group tourism activities based on similarities in business practices, primarily used for statistical analysis
- Tourism: the business of attracting and serving the needs of people travelling and staying outside their home communities for business and pleasure
- Tourism Industry Association of BC ( TIABC) : a membership-based advocacy group formerly known as the Council of Tourism Associations of BC (COTA)
- Tourism Industry Association of Canada (TIAC): the national industry advocacy group
- Tourist: someone who travels at least 80 kilometres from his or her home for at least 24 hours, for business or pleasure or other reasons; can be further classified as domestic, inbound, or outbound
- United Nations World Tourism Organization (UNWTO) : UN agency responsible for promoting responsible, sustainable, and universally accessible tourism worldwide
- List the three types of tourist and provide an example of each.
- What is the UNWTO? Visit its website, and name one recent project or study the organization has undertaken.
- List the five industry groups according to the North American Industry Classification System (NAICS). Using your understanding of tourism as an industry, create your own definition and classification of tourism. What did you add? What did you take out? Why?
- In 2011, how much money was generated by tourism worldwide? What percentage of this money was collected in Europe? Where was the least amount of money collected?
- According to UNEP, what are the four types of negative environmental tourism impact? For each of these, list an example in your own community.
- What major transportation developments gave rise to the tourism industry in Canada?
- Historically, what percentage of international visitors to Canada are from the United States? Why is this an important issue today?
- Name three key events in the history of BC tourism that resonate with you. Why do you find these events of interest?
- Watch the video in the “Take a Closer Look” feature on Richmond. Now think about the value of tourism in your community. How might this be communicated to local residents? List two ways you will contribute to communicating the value of tourism this semester.
- Choose one article or document from the reference list below and read it in detail. Report back to the class about what you’ve learned.
Case Study: Tourism – Canada’s Surprise Blind Spot
In a 2014 episode of the Voice of Canadian Business , the Canadian Chamber of Commerce’s podcast, host Mary Anne Carter sat down with Greg Klassen, the CTC’s president and CEO, and Michele Saran, executive director of Business Events Canada. Their discussion highlighted the reasons Canada is struggling to remain competitive within the sector, and underscores the role and impact Canada’s tourism industry has on the economy.Listen to the 14-minute podcast on tourism in Canada and answer the following questions: www.chamber.ca/media/pictures-videos/140407-podcast-tourism/
- Why are governments around the world starting to invest in tourism infrastructure? What does this mean for the competitive environment for Canada’s tourism product?
- How do we compare to the United States as a destination for business travel?
- According to Greg, why is the $200 million investment in Brand USA a “double-edged sword” for tourism in Canada? What is beneficial about this? Why does it make things more difficult?
- What is the relationship between tourism and people’s understanding of a country’s image?
- What ranking is Canada’s brand? What other industries are affected by this brand?
- Describe one activity the CTC participates in to sell Canadian tourism product abroad.
- Name two “sectors of excellence” for Canada. Why is the CTC focussing their business events sales strategies on these industries?
- What does the CTC consider to be the benefits of Vancouver hosting the 2014 and 2015 TED conferences?
Brewster Travel Canada. (2014). About Us – Brewster History . Retrieved from http://www.brewster.ca/corporate/about-brewster/brewster-history/
British Columbia Ministry of Jobs, Tourism and Skills Training . (2013a). BC Stats: Industry Classification . Retrieved from http://www.bcstats.gov.bc.ca/StatisticsBySubject/BusinessIndustry/IndustryClassification.aspx
British Columbia Ministry of Jobs, Tourism and Skills Training. (2013b). Bill 3 – 2013: Destination BC Corp Act . Retrieved from https://www.leg.bc.ca/39th5th/1st_read/gov03-1.htm
Canadian Geographic . (2000, September). Flying through time: Canadian aviation history . Retrieved from http://www.canadiangeographic.ca/magazine/so00/aviation_history.asp
Canadian Tourism Commission. (2014). About the CTC. Retrieved from http://en-corporate.canada.travel/about-ctc
Chaney, Edward. (2000). The evolution of the grand tour: Anglo-Italian cultural relations since the Renaissance . Portland OR: Routledge.
Cox & Kings. (2014). About us – History. Retrieved from http://www.coxandkings.co.uk/aboutus-history
Dawson, Michael. (2004). Selling British Columbia: Tourism and consumer culture, 1890-1970 . Vancouver, BC: UBC Press.
Discover Hospitality. (2015). What is hospitality? Retrieved from http://discoverhospitality.com.au/what-is-hospitality/
e-Know. (2011, November). Ogilvie’s past in lock step with last 50 years of Kimberley’s history. Retrieved from www.e-know.ca/news/ogilvie’s-past-in-lock-step-with-last-50-years-of-kimberley’s-history/
Expedia, Inc. (2013). Expedia: Annual report 2013. [PDF] Retrieved from http://files.shareholder.com/downloads/EXPE/3546131959x0x750253/48AF365A-F894-4E9C-8F4A-8AB11FEE8D2A/EXPE_2013_Annual_Report.PDF
Flightglobal. (2002). Sixty years of the jet age. Retrieved from http://www.flightglobal.com/features/jet-age/
Globe and Mail, The. (2014, March 28). Ten things you don’t know about Air Canada. Retrieved from http://www.theglobeandmail.com/life/travel/travel-news/10-things-you-likely-dont-know-about-air-canada/article17725796/?page=all
Government of Canada. (2006). Building a national tourism strategy. [PDF] Retrieved from https://www.ic.gc.ca/eic/site/034.nsf/vwapj/tourism_e.pdf/$FILE/tourism_e.pdf
Government of Canada. (2013, July 5). Appendix E: Tourism industries in the human resource module . Retrieved from http://www.statcan.gc.ca/pub/13-604-m/2013072/appe-anne-eng.htm
Griffiths, Ralph, Griffiths, G. E. (1772). Pennant’s tour in Scotland in 1769. The Monthly Review; or, Literary Journal XLVI : 150 . Retrieved from Google Books .
Gyr, Ueli. (2010, December 3). The history of tourism: Structures on the path to modernity. European History Online (EHO). Retrieved from http://ieg-ego.eu/en/threads/europe-on-the-road/the-history-of-tourism
Latin definition for hospes, hospitis. (2014).In Latdict – Latin Dictionary and Grammar Resources . Retrieved from http://www.latin-dictionary.net/definition/22344/hospes-hospitis
Library and Archives Canada. (n.d.). Ties that bind: Essay. A brief history of railways in Canada. Retrieved from http://www.collectionscanada.gc.ca/trains/021006-1000-e.html
LinkBC. (2008). Transforming communities through tourism: A handbook for community tourism champions. [PDF] Retrieved from http://linkbc.ca/siteFiles/85/files/TCTT.pdf
MacEachern, A. (2012, August 17). Goin’ down the road: The story of the first cross-Canada car trip. The Globe and Mail . Retrieved from http://www.theglobeandmail.com/news/national/goin-down-the-road-the-story-of-the-first-cross-canada-car-trip/article4487425/
McLeish. (2014, July 23). History of heliskiing in Canada. Retrieved from www.lastfrontierheli.com/news/1607/history-of-heliskiing-in-canada/
Magnes, W. (2010, May 26). The evolution of British Columbia’s tourism regions: 1970-2010 [PDF] . Retrieved from http://linkbc.ca/siteFiles/85/files/LinkBCMagnesPaper2011.pdf
Porges, R. (2014, September). Tell me something I don’t know: Promoting the value of tourism. Tourism Drives the Provincial Economy . Presentation hosted by the Tourism Industry Association of BC, Vancouver, BC.
PricewaterhouseCooopers, LLC. (2009). Opportunity BC 2020: Tourism sector. [PDF] Prepared for the BC Business Council. Retrieved from http://www.bcbc.com/content/558/2020_200910_Mansfield_Tourism.pdf
Shoalts, A. (2011, April). How our national parks evolved: From Grey Owl to Chrétien and beyond, 100 years of Parks Canada. Canadian Geographic . Retrieved from http://www.canadiangeographic.ca/magazine/apr11/national_parks_evolution.asp
Theobald, William F. (1998). Global Tourism (2nd ed.). Oxford, England: Butterworth–Heinemann, pp. 6-7.
Thomas Cook Group of Companies. (2014). Thomas Cook history. Retrieved from http://www.thomascook.com/thomas-cook-history/
Tourism Industry Association of BC. (2014). Value of tourism toolkit: Why focus on the value of tourism? Retrieved from http://www.tiabc.ca/value-of-tourism-toolkit
Tourism Industry Association of Canada. (2014, October 14). Travel industry poised to boost Canadian exports: US market and border efficiencies central to growth potential . Retrieved from http://tiac.travel/cgi/page.cgi/_zine.html/TopStories/Travel_Industry_Poised_to_Boost_Canadian_Exports_US_Market_and_Border_Efficiencies_Central_to_Growth_Potential
Tourism Industry Association of Canada, HLT Advisory. (2012). The Canadian tourism industry: A special report [PDF] . Retrieved from http://www.hlta.ca/reports/The_Canadian_Tourism_Industry_-_A_Special_Report_Web_Optimized_.pdf
United Nations and World Tourism Organization. (1995). Recommendations on tourism statistics. [PDF] Retrieved from http://unstats.un.org/unsd/newsletter/unsd_workshops/tourism/st_esa_stat_ser_M_83.pdf
United Nations Environment Programme. (2003a). Negatives Socio-cultural impacts from tourism . Retrieved from http://www.unep.org/resourceefficiency/Business/SectoralActivities/Tourism/FactsandFiguresaboutTourism/ImpactsofTourism/Socio-CulturalImpacts/NegativeSocio-CulturalImpactsFromTourism/tabid/78781/Default.aspx
United Nations Environment Programme. (2003b). Tourism’s three main impact areas. Retrieved from http://www.unep.org/resourceefficiency/Business/SectoralActivities/Tourism/TheTourismandEnvironmentProgramme/FactsandFiguresaboutTourism/ImpactsofTourism/EnvironmentalImpacts/TourismsThreeMainImpactAreas/tabid/78776/Default.aspx
United Nations World Tourism Organization. (2008). Understanding tourism: Basic glossary . Retrieved from http://media.unwto.org/en/content/understanding-tourism-basic-glossary
United Nations World Tourism Organization. (2012, May 7). International tourism receipts surpass US$ 1 trillion in 2011. Retrieved from http://media.unwto.org/en/press-release/2012-05-07/international-tourism-receipts-surpass-us-1-trillion-2011
United Nations World Tourism Organization. (2014a). UNWTO world tourism barometer, 12 [PDF] (1). Retrieved from http://dtxtq4w60xqpw.cloudfront.net/sites/all/files/pdf/unwto_barom14_04_august_excerpt_0.pdf
United Nations World Tourism Organization. (2014b). Who we are. Retrieved from http://www2.unwto.org/content/who-we-are-0
Attributions
Figure 1.1 Selkirk College and Nelson by LinkBC is used under a CC-BY 2.0 license.
Figure 1.2 Capilano University’s Team by LinkBC is used under a CC-BY 2.0 license.
Figure 1.3 Vancouver Island University by LinkBC is used under a CC-BY 2.0 license.
Figure 1.4 Canadian Pacific 4-4-0 A-2-m No 136 by Peter Broster is used under a CC-BY 2.0 license.
Figure 1.5 Vancouver Island University by LinkBC is used under a CC-BY 2.0 license.
Figure 1.6 Switzerland vs. Canada by s.yume is used under a CC-BY 2.0 license.
Figure 1.7 CTC’s Boardroom by LinkBC is used under a CC-BY 2.0 license.
Introduction to Tourism and Hospitality in BC Copyright © 2015 by Capilano University is licensed under a Creative Commons Attribution 4.0 International License , except where otherwise noted.
Share This Book
How and When Did Tourism Start?
Most of us love to travel and when we think about travelling, what we probably have in mind are the best two or three weeks of the year. Tourism has become a major industry and it creates around 100 million jobs worldwide.

Achim Riemann
In 1854, the first travel agency opened. In 1869, one of the first group tours was launched. It included attendance at the opening of the Suez Canal in Egypt.
But how did it all start?
A long time ago, people initially moved around for practical reasons, such as looking for food or water, or fleeing natural disasters or enemies. But as early as ancient Egypt and in the other “high” cultures found throughout the continents at the time, people started to travel for religious reasons. They set out on pilgrimages, for example to Mecca, or on journeys to take a ritual bath in the Ganges River. That was the beginning of tourism.
What about modern tourism?
Modern tourism can be traced back to the so-called “Grand Tour”, which was an educational journey across Europe. One of the first who embarked on this journey was the King of Poland and Grand Duke of Lithuania, Wladyslaw IV Vasa, also known as Wladislaus Sigismundus, Prince of Poland and Sweden. And yes, the grand tour was just for the super-rich. In 1624, Wladyslaw travelled to Germany, Belgium, the Netherlands, France, Switzerland, Italy, Austria and the Czech Republic. (1)
Poor or even normal people had neither the money nor the time to go on a holiday. However, that started to change at the end of the 19th century. Around 1880, employees in Europe and North America were granted their first work-free days besides Sundays and the mostly Christian holidays, such as Easter or Christmas. These extra work-free days were usually unpaid in the beginning. Since most people couldn’t spare the money for travel, this led to excursions into the surroundings rather than travelling.

The founders of international “tourism” in Europe were the British
Thomas Cook is considered the founder of what is known as organized “package” holidays. In the last decades of the 19th century, the upper social classes in England were so wealthy due to the income from the British Empire that they were the first to be able to afford trips to far-flung areas. (1)
In 1854, the first travel agency opened. In 1869, one of the first group tours was launched. It included attendance at the opening of the Suez Canal in Egypt. From 1889, people took holiday cruises on steamships with musical performances. Seaside holidays became really popular around 1900 (and continue to be popular to this today). From the 1970s onwards, many in the industrialised countries could finally afford a holiday trip. The first criticism over this arose at the beginning of the 1970s: due to tourism, there were as many tourists in Spain in 1973 as there were inhabitants. (2)
In 2019, before the coronavirus pandemic, 1.5 billion tourist arrivals were recorded around the world, a 4% increase compared to 2018's figures. The most visited countries in 2019 were France with 89 million tourists, followed by Spain with 83 million tourists and the United States with 80 million tourists. China and Italy sit at fourth and fifth places, respectively, with 63 million tourists in China and 62 million tourists in Italy. (3)
And what are the most visited tourist attractions worldwide? According to a recent research from TripAdvisor, these are the top five: the Colosseum (Italy), the Louvre (France), the Vatican, the Statue of Liberty (USA), the Eiffel Tower (France) (4).
- Wikipedia: https://de.wikipedia.org/wiki/Tourismus , 12.03.2022
- Wikipedia: https://de.wikipedia.org/wiki/Massentourismus , 12.03.2022
- TravelBook: https://www.travelbook.de/ziele/laender/die-meistbereisten-laender-der-welt
- Travel Wanderlust: https://www.travelwanderlust.co/articles/most-visited-tourist-attractions-in-the-world/ 12.03.2022
Subscribe to newsletter

Access and Info for Institutional Subscribers
Timeline of technological advancements in the tourism industry.
- This timeline showcases the chronological progression of technological advancements in the tourism industry. It provides a visual representation of key milestones and shifts in technology that have shaped the industry.
- Research Question: How have technological innovations influenced the tourism industry?
The timeline captures crucial moments such as the emergence of online travel agencies, the introduction of smartphones and mobile travel apps, the rise of the sharing economy, and the integration of artificial intelligence in travel services.
Groups audience:
- Topics ›
- Tourism worldwide ›
International Tourism: The Long Road to Recovery
Tourism recovery.
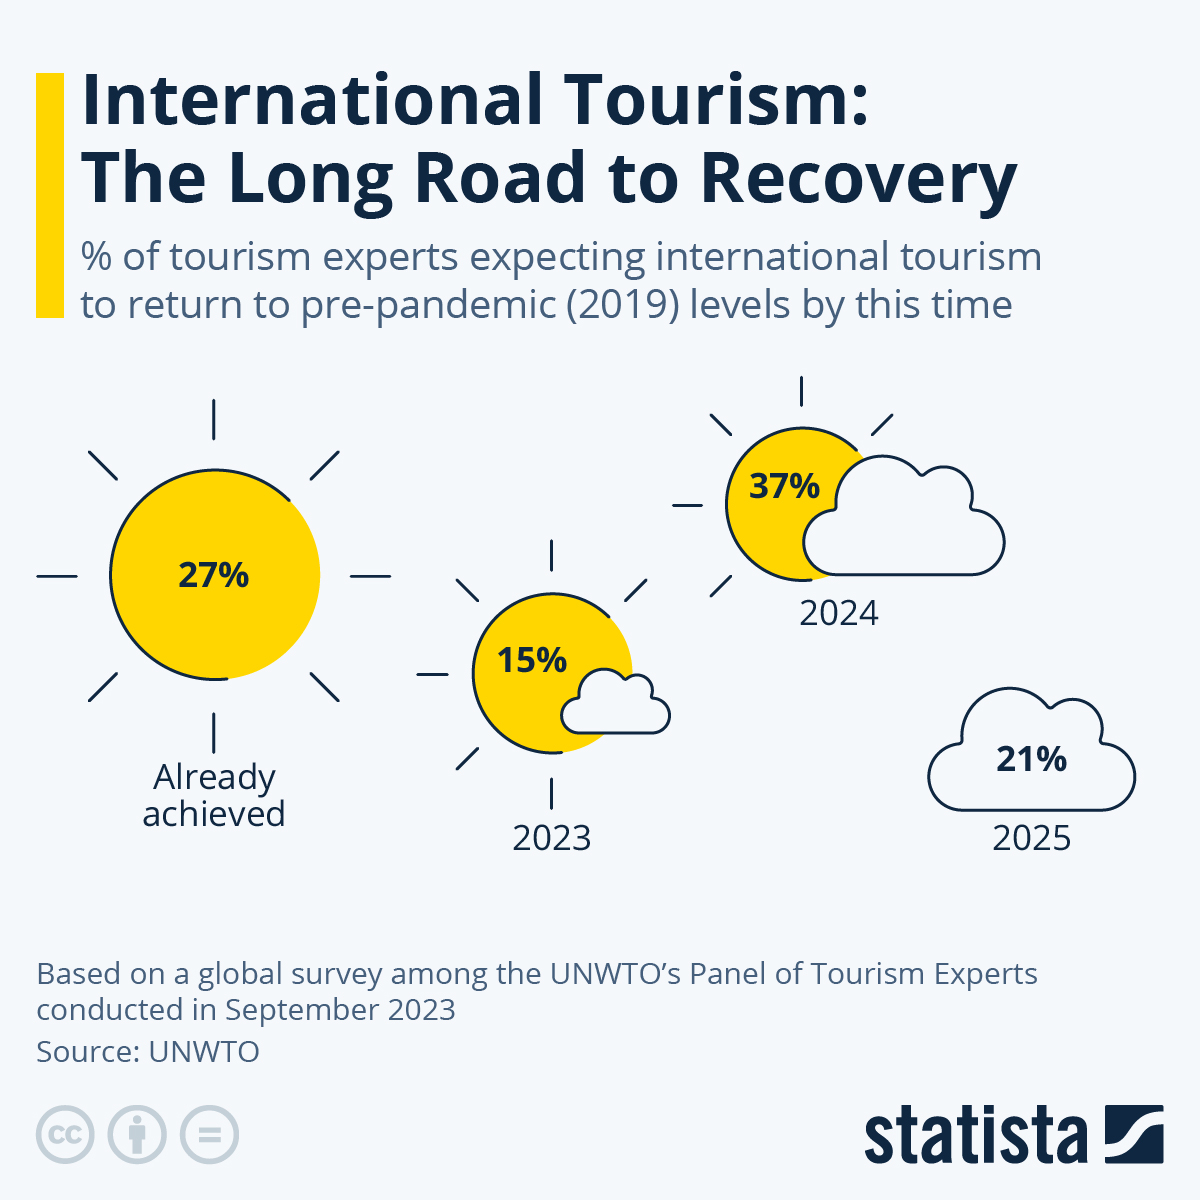
Following the worst year in tourism history and a year 2021 that was only marginally better due to the persistent threat posed by Covid-19, 2022 marked the first significant improvement for the global tourism industry. According to the United Nations World Tourism Organization (UNWTO), international tourist arrivals reached 66 percent of 2019 levels in 2022, up from 28 and 30 percent, respectively, in 2020 and 2021. In the first seven months of 2023, international travel continued its recovery despite difficult economic circumstances, but remained 16 percent below 2019 levels, as the road to full recovery is proving longer than initially hoped.
While a brief rebound in the summer months of 2020 had fueled hopes of a quick recovery for the tourism sector, those hopes were dashed with each subsequent wave of the pandemic. And despite a historically fast global vaccine rollout, travel experts struggled to stay optimistic in 2021, as governments kept many restrictions in place in their effort to curb the spread of new, potentially more dangerous variants of the coronavirus.
And while most of these restrictions have been lifted now, the weak economic outlook, geopolitical uncertainties and the inflation crisis have been weighing on the tourism sector's recovery. According to UNWTO's latest Tourism Barometer , industry experts remain cautiously optimistic with respect to tourism's full recovery, however, as travel demand remains surprisingly resilient in the face of these headwinds.
52 percent of tourism experts surveyed by the UNWTO in September 2023 expect international travel to return to pre-pandemic levels in their country either this or next year, while another 27 percent think that their country's tourism sector has already fully recovered. Still, 1 in 5 experts expect the recovery to take until 2025 or later, showing once more how hard the tourism sector has been affected by the pandemic.
Description
This chart shows when tourism experts expect international tourism to return to pre-pandemic levels.
Can I integrate infographics into my blog or website?
Yes, Statista allows the easy integration of many infographics on other websites. Simply copy the HTML code that is shown for the relevant statistic in order to integrate it. Our standard is 660 pixels, but you can customize how the statistic is displayed to suit your site by setting the width and the display size. Please note that the code must be integrated into the HTML code (not only the text) for WordPress pages and other CMS sites.
Infographic Newsletter
Statista offers daily infographics about trending topics, covering: Economy & Finance , Politics & Society , Tech & Media , Health & Environment , Consumer , Sports and many more.
Related Infographics
Sponsored post by booking.com, where domestic tourism matters most to local accommodation businesses, sponsored post by booking.com, tourism is a catalyst for more equitable development, tourism & hospitality, the top destinations of indian tourists, the most important markets for the maldives tourism industry, 10 cities with the highest growth potential for international visitor spending, 2032: hong kong to attract more international spending than any other city in the world, the world's largest tourism spenders, economic environment weighing heavily on the travel industry, domestic spending in tourism eclipses international for the major cities, domestic gives way to international travel: 2032 forecast, sponsored by booking.com, when will the us’ top visitors return, britons' favorite travel destinations.
- Who may use the "Chart of the Day"? The Statista "Chart of the Day", made available under the Creative Commons License CC BY-ND 3.0, may be used and displayed without charge by all commercial and non-commercial websites. Use is, however, only permitted with proper attribution to Statista. When publishing one of these graphics, please include a backlink to the respective infographic URL. More Information
- Which topics are covered by the "Chart of the Day"? The Statista "Chart of the Day" currently focuses on two sectors: "Media and Technology", updated daily and featuring the latest statistics from the media, internet, telecommunications and consumer electronics industries; and "Economy and Society", which current data from the United States and around the world relating to economic and political issues as well as sports and entertainment.
- Does Statista also create infographics in a customized design? For individual content and infographics in your Corporate Design, please visit our agency website www.statista.design
Any more questions?
Get in touch with us quickly and easily. we are happy to help.
Feel free to contact us anytime using our contact form or visit our FAQ page .
Statista Content & Design
Need infographics, animated videos, presentations, data research or social media charts?
More Information
The Statista Infographic Newsletter
Receive a new up-to-date issue every day for free.
- Our infographics team prepares current information in a clear and understandable format
- Relevant facts covering media, economy, e-commerce, and FMCG topics
- Use our newsletter overview to manage the topics that you have subscribed to

History of Tourism- Events
The olympic games.

The Roman Empire (27BC to 476)- Roads

Age of Discovery- 1415 to 1543

Canterbury Tales

Grand Tours by Thomas Cook

Developments in transports-17th and 18th centuries

MASS TOURISM
Organised tours/ excursions.

First International Exhibition

First Jet Airliners

Formation of the World Tourism Organization (UNWTO)

50 Free Timeline Infographic Templates: Amazing Free Collection
- Share on Facebook
- Share on Twitter
By Lyudmil Enchev
in Free Vectors , Freebies
3 years ago
Viewed 58,118 times
Spread the word about this article:
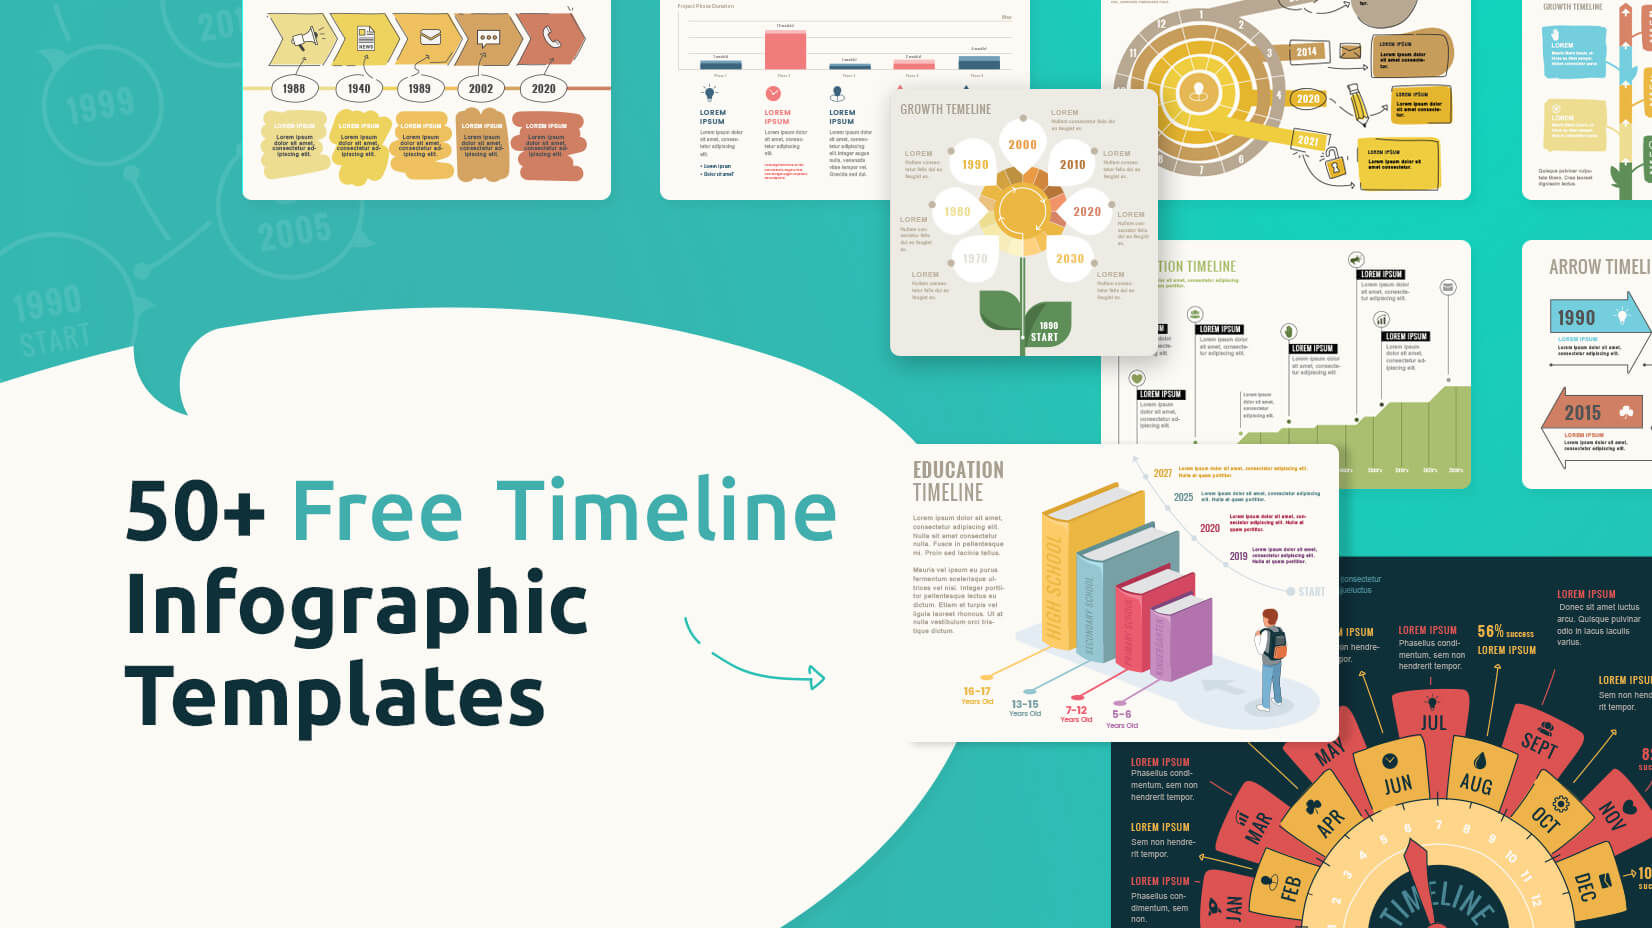
Creating beautiful infographics can be a time-consuming and daunting task for a non-designer. And we all know how important an infographic can be for an educational, innovative, or environmental project. Don’t worry! We’ve designed 50 free timeline-related infographic templates for you, which are easily customizable, in different design styles to cover, we hope, every project you have in mind.
Have a look at what we hand-picked for you, choose your favorite and click the button below the infographic to download it for free , and start filling in your information – it’s easy as that!
If you are looking for Free Google Slides Templates or Free PowerPoint Templates , don’t miss our articles!
1. Free Modern Timeline Infographic

This free modern timeline infographic is a perfect way to display important milestones for your business, your progress through the years, or any other growth. The colors are calm, muted, easy on the eyes, which will appeal to the audience with a less in-your-face-design. If you want to be friendly, organized, and achieve a clean look – this infographic is a great fit for your needs.
Available in: .PPT, .EPS

2. Free Colorful Timeline Infographic Template

This infographic is offering a more dynamic composition of the elements, which makes it more playful, active, and innovative. Sure, it’s not one of the most conventional ones, but no everyone wants to be, right? If you want to surprise, while still being organized, clear, and concise – pick this infographic.
Available in: .EPS
3. Free Chronology Timeline Infographic Template
Do you like the retro look? Ok, because this infographic certainly has this feel – the color scheme, simplified shapes, and outlined illustrations. A great addition is the text box on the left, where you can fit a bit of additional info. Overall, simple, effective, and fun design.
4. Free Minimalist Modern Infographic Template Design

A Cool infographic with a circle as the main design element. Many people read clockwise and when presented with many pieces of information, the circular motion helps guide the eye. The fresh colors and the original design make this infographic worth including in your designs and content.
5. Free Company Timeline Infographic Template

This is the next free timeline infographic, but this time with a darker background. Here, the emphasis is on the boxes with dates, not so much on the description. The curved timeline is very pleasing to the eye.
6. Free Hand-Drawn Infographic Template

Another circle timeline, but in a different style – hand-drawn. In 2021 hand-drawn style illustrations are hit. If your brand is playful, creative, and fun, this infographic is a great pick for your designs.
7. Hand-Drawn Style Infographic Timeline Template – Light

If you are looking for more simple illustrations, these hand-drawn, organic, pastel shapes are a great addition to your designs. This free infographic resembles a tree – don’t forget that 2021 is the year of design with natural elements.
8. Hand-Drawn Style Infographic Timeline Template – Dark

Looking for an attention-grabber? So pick this dark version of the previous infographic. It’s simple, interesting and, of course, free!
9. Free Timeline Infographic Template with Arrows

The information blocks in this infographic are divided into parallel lines and this makes the scanning of the information easier. It’s another free resource with a hand-drawn design, which is going strong in 2021.
10. Arrows by Years Free Timeline Infographic Template

If you like arrows, this arrow timeline is free, and you can grab it right away and use it in your content. It’s clean, straight-forward, and fully-editable.
11. Free Evolution Timeline Infographic Template
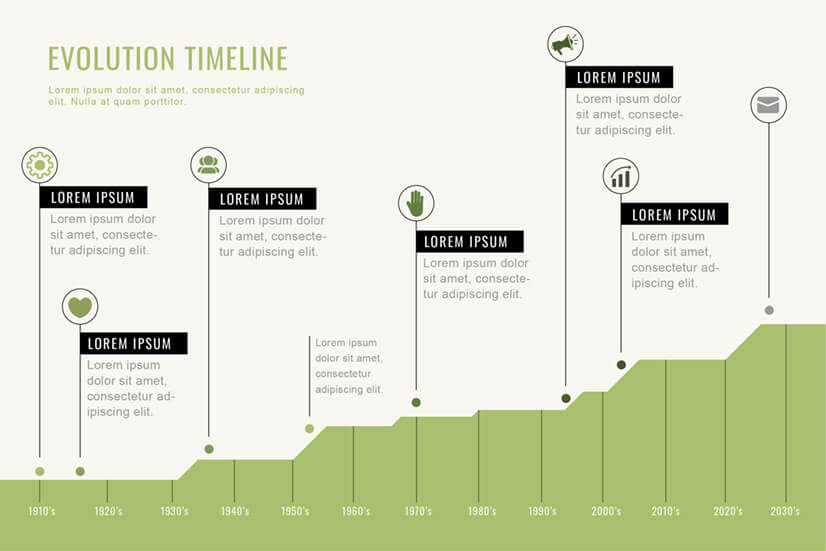
If you prefer a more minimalistic style infographic – this free timeline infographic is a great option! It uses a simple color scheme, thin and elegant lines, and an interesting timeline, reminding a landscape.
12. Free Light Evolution Timeline Infographic Template with Illustrations

Perfect timeline infographic for education, school, and storytelling – it consists of illustrations of the human evolution in pastel colors and a flat design style.
13. Free Dark Evolution Timeline Infographic Template with Illustrations

If you prefer a more dramatic presentation, this infographic is the same as the last one, but it’s darker. It’s always great to have a choice!
14. Free Blank Timeline Infographic Template Light

If the earthy tones are your thing – this one is for you! It’s simple, with natural, rounded shapes and clocks (in case you need to indicate some time).
15. Free Blank Timeline Infographic Template Dark

Another take on the earthy-themed infographic – a green one. The colors are muted, natural, and relaxing – so it’s the perfect pick for many projects.
16. Free Educational Infographic Template with Timeline

Here is an infographic with some 3d elements, explaining the different stages of education. You can use it on educational websites, sites targeting new parents, who, for example, are eager to learn about their kid’s education fast.
17. Free Timeline Infographic Template with Books – Light

Many school projects are in need of infographics with book illustrations. These simple, outlined illustrations are fresh and they fit into almost any project.
18. Free Timeline Infographic Template with Books – Dark

If you liked the last infographic, you can as well download this one – in some cases, a darker background would be more suitable. It’s free, so why not have them both?
19. Free Education Stages Timeline Infographic Template – Light

Organic shapes and lines are always pleasing to the eye – and this infographic makes good use of this fact. The free infographic is minimalistic, with simple, flat icons and calming colors.
20. Free Education Stages Timeline Infographic Template – Dark

If you prefer a darker design, you can download this one. As with all the infographics in our selection – it’s free.
21. Free Infographic Template for School with Pencil Illustration

This school infographic has an original design – with a sliced pencil. It makes the displayed information more interesting and memorable. It’s free and easy to customize for your educational projects.
22. Free Comparison Timeline Infographic Template

An infographic with cool cartoon characters will always leave a strong impression on your audience. A picture is worth a thousand words, so including cartoons in your infographic can give extra information, without the need to write it. Great free infographic with which you can make a comparison between different timelines, different buyer personas, etc.
23. Free Journey Travel Infographic Template

The fresh colors, the small nature, and travel illustrations, the line resembling a road are creating a great vibe and a mood for traveling. You can easily attract and keep the attention of your adventurous customers and readers with this cool, free infographic.
24. Free Road Timeline Infographic Template

If you need a journey infographic, looking more corporate, this one is the right pick for you – dark background, simple icons, and minimum of details.
25. Trip and Traffic Timeline Infographic Template with Car Illustration

The car illustration adds movement and it’s a playful element to the design. The design is especially suitable for mechanics and car service.
You may be also interested in some of these related articles:
- 47 Free PSD Infographic Templates to Download Right Now
- How to Make an Engaging Infographic: The Full Guide
26. Free Cartoon Style Timeline Infographic Template
The wobbly freehanded lines are a fun element to this design and make the infographic appealing to a broad audience. The free infographic also includes outline illustrations, color bubbles, and skewed lines and rectangles.
27. Free Chronology Timeline Infographic Template

If you prefer more geometric shapes and a cleaner look, you can pick this infographic for your projects. It’s free, ready to download and it can solve your design dilemmas in minutes.
28. Free Timeline Speed Infographic Template

This infographic includes a big arrow, suggesting progress, movement, and speed. If you can recognize your brand in these keywords, the infographic is a perfect addition to your content.
29. Free Ecology Infographic Template Timeline

This infographic is a great choice for environmental projects. It’s delicate, it’s green, and offers enough space to fit the information you want.
30. Free Growth Timeline Progress Infographic Template

Gardening is becoming a favorite hobby of many people around the world in recent years. No doubt, this free infographic would be useful for all nature-lovers. The simplified plant illustrations are a nice touch.
31. Free History Timeline Infographic Template

Historical events are usually complex and the bubbles of this free infographic provide enough space to explain what you need in detail. The focus is on the dates and the information bubbles and distracting elements are removed from the design.

32. Free Floral Infographic Template Design Light

Beautiful floral design infographic representing growth, life, and nature. We can imagine it as an eye-catcher for many projects. Download it for free.
33. Free Floral Infographic Template Design Dark

This plant infographic with a dark background is a perfect representation of any for plants, their life cycles, and growth-related projects. No matter the case, the infographic is beautiful, editable and it is for sure memorable and different.
34. Free Green Business Infographic Template – Light

The infographic is perfect for innovation projects. The relaxing, green colors, the curved line, and the simplified lightbulbs are nice design elements, which will help you illustrate your point and grab your audience’s attention.
35. Free Green Business Infographic Template – Dark

If you prefer darker themes, this green business infographic is a great choice for your projects. It’s free, you can download it fast and start customizing!
36. Free Blank Timeline Infographic Template Design

Card design is always in trend. This infographic combines a simple timeline and cards, with nice, rounded corners. It’s a simple, neutral visual, suitable for many projects.
37. Free Earth History Timeline Infographic Template

If you need a simple design to visualize historical events, this infographic is free and easy to edit. You can fill out all the important info in just minutes. You can use it as a template for other events and lessons too.
38. Creativity Timeline Infographic Template

Creatives value original, unique designs more than anyone else. This simplified pencil infographic would satisfy a designer’s aesthetic needs and at the same time, provide a simple, free template to customize and play with.
39. Free Circle Timeline Infographic Template – Light

This simple flat design timeline infographic has a nice hierarchy of elements, which leads the viewer’s eye and makes memorizing the information easier. And we all know, that one of the most important characteristics of an infographic is readability.
40. Free Simple Timeline Infographic Template

Infographic with some electronic, robotic, futuristic elements. Maybe it’s a good addition to your tech content and projects? You can get it for free, by clicking the button below.
41. Circle Style Free Timeline Infographic Template

The infographic above is our next free resource. It has a little thermometer, just in case, your project is related to geography, environmental issues, etc.
42. Creative Timeline Infographic Template

It’s time to see an infographic with more-vivid and popping colors! We understand that your brand might want to make a bold, fun statement and that’s why we included this infographic, just for you!
43. Minimalist Timeline Progress Infographic Template

Free minimalist timeline infographic template – a perfect choice for fashion brands, influencers, and all minimalism lovers. The colors are quite trendy this year, so don’t miss out on this free resource.
44. Free Abstract Timeline Infographic Template

We think this infographic is particularly suitable for biology projects with its organic shapes, a small human figure and bubbles, resembling cells. Well, it depends on your own imagination, of course, but it’s free, different, airy and it will definitely make a great impression!
45. Professional Timeline Infographic Template with Ratings

The shadows in this design add dimension and make this free infographic template even cooler. You can also take advantage of the included rating stars. Get it for free by clicking the button below.
46. Free Flat Design Timeline Infographic Template

Purples, reds, and pinks are often associated with female brands. The feminine color scheme and the simple structure of this infographic create a nice balance between something soft and sweet and something that’s serious.
47. Free Project Timeline Infographic Template – Light

The infographic is modern, minimalistic and you will certainly make a good impression on your audience with it. It’s customizable, so you can easily adjust it to fit your needs.
48. Free Project Timeline Infographic Template – Dark

Another free project infographic, but this time with darker colors. It’s up to you, which one will best suit your project and ideas.
49. Free Timeline Infographic Template with Flags – Dark

The cool flags are a fun element of this infographic. If you are looking for something a little different from what you are used to – pick this one for free.
50. Free Timeline Infographic Template with Flags – Light

Same infographic as the last one, but this time with lighter colors. Don’t waste time in figuring out the right colors – just pick the pre-made theme you like more and you are good to go.
Final words
We hope that you found a little something for you in this free infographic templates list! If we’ve missed something, let us know, we’d be glad to update our resources in the future.
We love to provide you with cool design solutions that you can customize in minutes, enjoy your content creation, and worry less about the design part.
- The Best Free Infographic Templates in 2022
- Infographics for Marketing: How to Grab and Hold the Attention
- 50+ Free Vector Infographic Templates: Multipurpose, Business, Ecology
Note: Eps format is a vector-based file, that is fully editable and can be opened in different vector-editing software. You can learn more about Eps and the other vector formats here: What is a Vector File? Everything You Need to Know

Add some character to your visuals
Cartoon Characters, Design Bundles, Illustrations, Backgrounds and more...
Like us on Facebook
Subscribe to our newsletter
Be the first to know what’s new in the world of graphic design and illustrations.
- [email protected]
Browse High Quality Vector Graphics
E.g.: businessman, lion, girl…
Related Articles
100+ adorable free baby cartoon vectors, clipart, and illustrations, free vector graphics on freepik by graphicmama, 20 great free google slides and powerpoint templates for teachers, 46 colorful adobe character animator backgrounds (free and premium), 30 free cute powerpoint templates: collection for a sweet presentation, check out our powerpoint infographics bundle with 500+ infographic templates:, enjoyed this article.
Don’t forget to share!
- Comments (0)

Lyudmil Enchev
Lyudmil is an avid movie fan which influences his passion for video editing. You will often see him making animations and video tutorials for GraphicMama. Lyudmil is also passionate for photography, video making, and writing scripts.

Thousands of vector graphics for your projects.
Hey! You made it all the way to the bottom!
Here are some other articles we think you may like:

Free Instagram Post Templates: Different Themes and Styles
by Lyudmil Enchev

60 Free Medical Background Resources with Modern Design
by Al Boicheva

Free Vectors
50 free cartoon superhero characters to power up your designs, looking for design bundles or cartoon characters.
A source of high-quality vector graphics offering a huge variety of premade character designs, graphic design bundles, Adobe Character Animator puppets, and more.
Do this, not that: Timeline infographics
Create beautiful charts & infographics get started, 26.07.2023 by anete ezera.
Timeline infographics are powerful visual tools that enable the representation of complex information in a clear and concise manner. Whether you want to showcase historical events, project timelines, or any sequence of events, timeline infographics are perfect for presentations , reports , and educational materials. With their ability to engage and inform audiences, infographic timelines have become an essential component of effective data visualization .
With Infogram, it’s easy to create visually appealing timeline infographics that score in interactivity and design. It provides a range of customizable templates, icons, and design options, making it an excellent choice for anyone who wants to create stunning visual content.
In this article, we’ll delve into the dos and don’ts of creating timeline infographics, focusing on how to maximize the potential of this visual medium and captivate your audience. Whether you’re a student presenting a history project, a professional delivering a business report , or an educator seeking to engage students, these guidelines will help you create effective and visually appealing timeline infographics using Infogram.
Without further ado, let’s explore the best practices for designing timeline infographics and unlock the potential of this visual format!
Click to jump forward: What are timeline infographics? Timeline infographic dos Timeline infographic don’ts Infographic timeline template Create impactful timeline infographics with Infogram

What are timeline infographics?
A timeline infographic is a visual representation of events or milestones arranged chronologically along a horizontal or vertical axis. It presents information in a sequential format, allowing viewers to understand the progression of time and the relationships between different events. Timeline infographics are often used to condense complex information into a simplified and visually appealing format, making it easier for audiences to grasp key details at a glance.
Furthermore, a timeline infographic is also a powerful storytelling tool that goes beyond presenting facts and figures . It helps viewers contextualize information and gain a deeper understanding of the historical or chronological significance of events. With its ability to condense complex information into a visually appealing format, a timeline infographic becomes an effective means of communication across various domains, from academia to business to journalism.
Timeline infographic dos
Clearly define your story.
Before diving into the design process, it’s crucial to establish the main objective of your timeline infographic . Clearly defining the purpose will help you make informed decisions about the layout, content, and visual elements. Are you aiming to present a historical timeline, a project’s milestones, or a sequence of events? Understanding the narrative you want to convey will guide you in selecting the appropriate template and structuring your infographic effectively.
Once you have identified the objective, it’s time to define a clear narrative that’ll guide the viewer through the sequence of events or milestones you wish to portray. Consider the key points you want to highlight and the story you want to tell. Will it follow a linear timeline, or will it branch out into different paths? By crafting a coherent narrative, you ensure that your timeline infographic not only presents information but also engages and informs your audience effectively.
Choose a suitable layout
When creating a timeline infographic, selecting the right layout is crucial in conveying your content and narrative effectively. Different layouts serve different purposes and can enhance the visual impact of your infographic.
For linear events that progress chronologically, a horizontal timeline is often the most suitable choice. This layout allows viewers to follow a straightforward timeline from left to right, mirroring the natural flow of time. Horizontal timelines work well for historical timelines, project milestones, or any sequential events that have a clear progression.
On the other hand, if your timeline infographic involves hierarchical or branching information, a vertical layout may be more appropriate. Vertical timelines provide a hierarchical structure, allowing viewers to navigate through different levels or branches of events. This layout is particularly useful when showcasing multiple parallel timelines, interrelated events, or different categories within the timeline.
Maintain chronological order
To create a coherent timeline infographic, it’s crucial to arrange the events or milestones in chronological order. This arrangement provides a logical flow of information that helps viewers grasp the progression of time.
Additionally, arranging events in chronological order helps establish a sense of context and continuity. It allows viewers to make connections between different milestones, see how one event leads to another, and gain a deeper understanding of the overall story or sequence being presented.
When designing your timeline infographic, take care to maintain the chronological order consistently throughout. Ensure that the events or milestones are positioned correctly along the timeline, making it easy for viewers to trace the progression of time. This approach facilitates a smoother reading experience and enhances the clarity and effectiveness of your timeline infographic.
Use consistent and appropriate icons
Icons play a significant role in enhancing the visual impact and communicative power of timeline infographics. They serve as visual cues that help viewers quickly grasp the essence of each event or milestone. When selecting icons for your timeline infographic, choose those that are consistent in style and directly related to the events or milestones being represented.
Consistency in icon style is important to maintain cohesive visual language throughout your infographic. Using icons that share a similar design style creates a harmonious and professional look. Whether you opt for minimalist icons, detailed illustrations, or stylized symbols, ensure that the chosen style remains consistent across all the icons used in your timeline.
Moreover, the icons should have a direct connection to the events or milestones they represent. They should be instantly recognizable and easily associated with the subject matter. For instance, if you’re creating a historical timeline, using icons of famous landmarks, significant objects, or renowned personalities can help viewers quickly identify the event or time period being depicted.
Use engaging visuals
To elevate your timeline infographics, incorporate engaging visuals such as images, videos, GIFs, stickers, and more . These multimedia elements not only provide additional context for your timeline but also make it more visually appealing and captivating for viewers.
Images are a powerful tool to enhance the storytelling aspect of your timeline infographic. They can help bring events to life by showcasing relevant photographs, illustrations, or diagrams that provide a visual representation of the subject matter. Images can evoke emotions, create a sense of authenticity, and add depth to the narrative.
Videos and GIFs offer a dynamic and interactive dimension to your timeline. They can be used to present animated sequences, highlight key moments, or provide a more immersive experience for viewers. Consider incorporating short video clips or animated GIFs that relate to specific events, adding movement and visual interest to your timeline infographic.
Stickers, icons, and other graphic elements can inject personality and style into your timeline. They can be used to visually distinguish different categories, highlight important milestones, or add a touch of creativity. Make sure to experiment with various graphic elements to create a visually cohesive and appealing timeline infographic.
Keep it concise and informative
When designing your timeline infographic, make sure to prioritize clarity in the textual elements. Avoid lengthy paragraphs or excessive text that can overwhelm and distract viewers from the main content. Instead, opt for concise captions or labels that provide essential information about each event or milestone.
Captions and labels should be clear and to the point. Use concise sentences or phrases that convey the key details or significance of each event. Consider using bullet points or numbered lists to organize information in a structured and easy-to-read format. This approach helps viewers quickly scan and absorb the essential information without feeling overwhelmed.
Use visual hierarchy
In order to create a visually engaging timeline infographic, it’s crucial to employ visual hierarchy techniques that emphasize important events or milestones. Visual hierarchy involves using various design elements, such as font size, color, and position, to guide the viewer’s attention and highlight key information.
One effective way to establish visual hierarchy is by adjusting the font size. Increase the size of the text for significant events or milestones to make them more prominent and easily noticeable. This draws the viewer’s attention and conveys their relative importance within the timeline.
Color can also be used strategically to create a visual hierarchy. Consider using bold or vibrant colors for crucial events or milestones, while using more subdued or muted tones for less significant ones. This contrast in color helps differentiate between different levels of importance and ensures that key events stand out visually.
The positioning of elements on the infographic can also contribute to visual hierarchy. Place important events or milestones in prominent locations, such as the center or at the top, to make them more noticeable. Use alignment and spacing techniques to create a clear visual structure that guides the viewer’s eye along the timeline.
Include a clear call to action
Don’t underestimate the power of a clear call to action (CTA) at the end of your infographic. It’s the bridge between the information you presented and what you want viewers to do next. A well-crafted CTA can be anything from prompting viewers to learn more on a dedicated webpage to encouraging them to follow you on social media. By using strong action verbs, keeping it visually distinct, and placing it strategically, your CTA can transform your infographic from a passive information source into an active engagement tool. This allows you to achieve your goals, whether it’s driving traffic to your website, generating leads, or simply building brand awareness.
Timeline infographic don’ts
Overcrowd the timeline.
One common pitfall to avoid when creating a timeline infographic is overcrowding it with too many events or milestones. It’s important to strike a balance and focus on the key points to prevent the infographic from becoming cluttered and overwhelming for viewers.
By selecting only the most relevant and impactful events or milestones, you can ensure that your timeline infographic maintains a clear and concise narrative. Consider the significance of each event and its contribution to the overall story you want to convey. Including too many minor or insignificant details can dilute the impact and make it challenging for viewers to grasp the main message.
Additionally, leave ample space between each event or milestone on the timeline. This spacing provides visual clarity and improves readability. It allows viewers to easily differentiate between individual events and absorb the information without feeling overwhelmed or confused.
Neglect design consistency
Consistency in design is paramount when creating a timeline infographic. It helps establish a cohesive visual language and enhances the overall clarity and understanding of the information presented. To achieve this, maintain consistency in colors, fonts, and overall style throughout the infographic.
Color consistency ensures that your timeline infographic has a harmonious and unified look. Select a color palette that aligns with your branding or desired aesthetic and use it consistently across all elements. Take advantage of Infogram’s themes that’ll ensure a consistent and visually appealing color scheme and typography throughout your design.
On that note, make sure to also maintain consistency in font choices. Select fonts that are easily readable and appropriate for the tone and purpose of your infographic. Use the same font or a complementary pair consistently for headings, captions, labels, and other text elements.
Overall style consistency is also vital to create a cohesive visual experience. Ensure that the style of icons, illustrations, and other graphic elements remains consistent throughout the infographic. This includes factors such as line thickness, illustration style, shading, or any other visual effects. Consistency in style helps viewers recognize and interpret visual cues consistently, facilitating understanding and engagement.
Overcomplicate the visuals
When designing a timeline infographic, it’s essential to strike a balance between creativity and clarity. While creativity adds visual interest and engagement, avoid using overly complex visuals that may distract or confuse the viewer.
Complex visuals, such as intricate illustrations or elaborate graphic effects, can sometimes overshadow the main content and hinder understanding. Keep in mind that the primary goal of a timeline infographic is to effectively convey information in a clear and concise manner. Therefore, focus on using visuals that enhance the content and contribute to the overall narrative rather than overwhelming or confusing the viewer.
Simplicity can be key to achieving clarity. Opt for clean and straightforward designs that allow the information to take center stage. Utilize visual elements that are easy to interpret and understand, ensuring that they support and reinforce the message without causing unnecessary distractions.
However, this doesn’t mean sacrificing creativity altogether. You can still incorporate creative elements such as visually appealing icons, unique layouts, or tasteful color schemes. The key is to ensure that these creative choices enhance rather than hinder the communication of information.
Forget about mobile-friendly design
In today’s mobile-driven world , it’s crucial to optimize your timeline infographic for different screen sizes. With an increasing number of people accessing content on smartphones and tablets, ensuring that your infographic is readable and properly formatted across various devices is essential.
Begin by designing your timeline infographic with a mobile-first mindset. Consider the limited-screen real estate of mobile devices and prioritize simplicity and clarity. Opt for a responsive design approach that automatically adjusts the layout and formatting based on the screen size.
Regularly test your infographic on different devices to ensure that it displays correctly and maintains readability. Pay attention to the font sizes, icons, and other visual elements to ensure they are not too small or distorted on smaller screens. Evaluate the overall flow and organization of information to ensure it remains coherent and easy to navigate.
Consider the interactivity and functionality of your infographic on mobile devices as well. If your infographic includes interactive elements, such as clickable buttons or swipeable sections, ensure they work seamlessly on touch screens.
By optimizing your timeline infographic for different screen sizes, you ensure that it reaches and engages a wider audience. Mobile optimization enhances the user experience and allows viewers to access and interact with your infographic conveniently, regardless of the device they use.
With Infogram’s mobile-responsive design features, you can easily create timeline infographics that automatically adjust and adapt to different screen sizes. This allows you to create content that others can easily access and interact with on their mobile devices.

Exclude a legend or key
When incorporating icons, symbols, or colors to represent different categories or themes in your timeline infographic, make sure to include a legend or key. The purpose of a legend is to provide clarity and enable viewers to understand the meaning behind the visual elements you’ve used.
A legend serves as a guide, helping viewers decipher the symbols, icons, or colors used in your infographic. It provides a clear explanation of what each visual representation represents, ensuring that viewers can interpret the information accurately. Without a legend, viewers may be left confused or make incorrect assumptions about the meaning behind the visuals.
When creating your legend, make sure it’s easily noticeable and placed in a strategic location within your timeline infographic. Typically, legends are positioned near the top or bottom of the infographic or in a corner where they don’t obstruct the main content. Use clear and concise descriptions or labels that correspond to the visual elements used throughout the infographic.
Additionally, consider using visual cues within the legend itself to reinforce the connection between the descriptions and the visual representations. For example, you can include miniaturized versions of the icons or symbols alongside their corresponding labels. This helps viewers make a direct association between the legend and the visual elements used in the timeline.
Skimp on proofreading
While designing a visually appealing timeline infographic is important, it’s equally as important to prioritize the accuracy of the content. Spelling or grammatical errors can undermine the credibility of your infographic and distract viewers from the main message. Therefore, always take the time to thoroughly proofread your content before finalizing the infographic.
Start by carefully reviewing the text elements within your timeline infographic. Check for any spelling mistakes, grammatical errors, or typos. Pay close attention to proper noun capitalization, punctuation, and sentence structure. Make sure that the text is grammatically correct and flows smoothly, enhancing the overall readability and understanding of the information.
Consider enlisting the help of a fresh pair of eyes, such as a colleague or a proofreading tool, to catch any errors that you may have missed. Another effective technique is to read the text aloud, as this can help identify awkward phrasing or incorrect grammar.
Proofreading also extends to checking the accuracy of the information presented in your infographic. Ensure that dates, names, facts, and other details are correct and properly cited.
Remember that your timeline infographic represents your professionalism and attention to detail. It helps you maintain a high standard of accuracy and professionalism, leaving a positive impression on viewers.
Infographic timeline template
When making an infographic, you might be seeking a way to speed up the process or look for guidance in design. Lucky for you, it’s easy to select a pre-designed template and customize it to your preferences while saving time and resources. Templates provide a solid foundation with pre-designed layouts, styles, and elements, allowing you to focus more on content and customization rather than starting from scratch.
On Infogram, infographic timeline templates are fully customizable, allowing you to adjust colors, fonts, icons, and layouts to align with your branding or design vision. With Infogram’s intuitive drag-and-drop editor, you can easily add, rearrange, and resize elements to create a visually appealing timeline infographic that suits your specific content and narrative. Whether you’re a beginner or an experienced designer, Infogram’s infographic timeline templates provide a user-friendly starting point to kickstart your creative journey.
Create impactful timeline infographics with Infogram
Timeline infographics are an effective way to present chronological information in a visually engaging manner. By following the dos and avoiding don’ts discussed in this article, you can create compelling and informative timeline infographics on Infogram. Remember to define a clear narrative, choose an appropriate layout, maintain chronological order, use consistent icons and visuals, optimize for mobile devices, avoid clutter, use visual hierarchy techniques, and proofread your content. With these guidelines, you can design timeline infographics that effectively convey information, captivate your audience, and make a lasting impact. So, go ahead and unleash your creativity, experiment with different designs, and craft timeline infographics that not only tell a story but also visually delight and inform viewers!
Interested in discovering how Infogram can enhance your team’s work? Join a brief Zoom session with our Infogram representative to explore key features, get answers to your questions, and understand how we can assist. It’s quick, informative, and just like a coffee break chat. Schedule your call now!
Get data visualization tips every week:
New features, special offers, and exciting news about the world of data visualization.
Join more than 200,000 readers and receive the latest data visualization news, tips and trends every week.
The complete guide to different types of charts, how to write an ai prompt: pro tips to unlock ai potential, create infographics with ai: fast, easy, and powerful.
Tourism Timeline Infographic Template

Download Template:
Get EdrawMax Now!
Share Template:
- Children's Day
- Valentine's Day
- Thanksgiving
- Architecture
- Environment
- Information
- Grand Opening
- Real Estate
- Advertising
- Twitter Headers
- Facebook Covers
- Google Plus Covers
- LinkedIn Covers
- Blog Banners
- Achievement
- Baby Shower
- Magazine Covers
- Annual Reports
- More Templates
History Infographics Templates
Discover the past through captivating visual storytelling with Venngage's history infographic templates. Effortlessly create timelines, events, and historical narratives that engage and inform audiences of all ages.
Other infographic templates
- Informational
- Statistical
- Human resources
- Graphic design
- Black history month
- Environment
- Real estate
- Cinco de mayo
- Memorial day
- Mental health
- Photography
Popular template categories
- Presentations
- White papers
- Letterheads
- Newsletters
- Business cards
- Certificates
- Invitations
- Social media
- Table of contents
- Magazine covers
- Price lists
- Album covers
- Book covers
- See All Templates

Nice to meet you.
Enter your email to receive our weekly G2 Tea newsletter with the hottest marketing news, trends, and expert opinions.
History of Infographics: Cave Symbols to Interactive Visuals
May 26, 2020
by Kai Tomboc

Ancient storytellers already understood that pictures are worth a thousand words – from depictions of volcanic eruptions to abstract symbols painted on caves.
Fast forward to today, and infographics have skyrocketed in popularity.
In this article, we'll take a closer look at the history of infographics: its origins, evolution through the centuries, and what lies beyond. You'll also meet the people behind the transformation of infographics over time – persuading skeptical governments to communicating with extraterrestrials.
Grab your beverage of choice and let's trace the roots of infographic design up to the present.
A complete infographic history timeline (in an infographic)
Talk about inception. Below you’ll find an infographic chock full of information about the historical timeline of infographics. We’ll break each of these sections down in more detail throughout the article.

Old-time visuals: the beginning of infographics
Infographics can be traced back to the spray-shaped images in the Chauvet-Pont d’Arc Cave in France at around 37,000 BC. They were believed to be painted at around the same time as nearby volcanoes erupted and spewed lava into the sky.
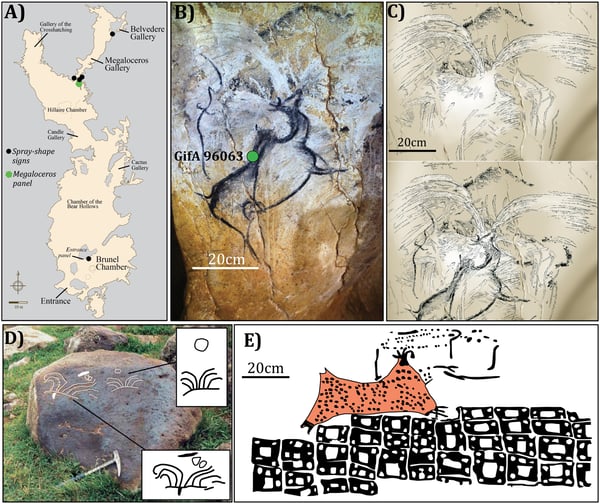
Meanwhile, several rock art specialists proposed that the rock art of Serra Da Capivara in Brazil is one of the oldest infographics, dating as far back as 36,000 years ago.
Paleolithic cave paintings (mostly large animals native to the region) in Lascaux, around the Dordogne region of southwestern France, were believed to be around 20,000 years old. Apart from their age, these paintings were also famous for their size, sophistication, and exceptional quality. Many other decorated caves were found in the area since the beginning of the 20th century.
The beginnings of infographics aren't just limited to caves and rocks. Early adventurers and old school explorers also created maps, a not-so-distant cousin of infographics.
The earliest-known map representing a natural landscape was a rough representation discovered in the Czech Republic, dating back to 25,000 BC. Around 3000 BC, ancient Egyptians invented and used hieroglyphics to tell stories of life, romance, work, and religion. By 600 BC, the Babylonians were already using accurate surveying or triangulation techniques to create maps.

The Babylonian Map of the World, the oldest surviving world map, dates back between 700 and 500 BC. It's worth noting, however, that this map is a symbolic rather than a literal representation of Babylonia. Next to surveying the land around them, the ancients also turn to the skies above.

The Dunhuang star atlas is one of the oldest graphics ever found. It has more than 1,300 stars depicted and dates back to 649 and 684 AD.
The accuracy and graphic quality of the ancient Chinese Atlas lie in its superior visual quality (for its time) and accuracy. With its origins and real use unknown until now, the old astronomical document includes both bright and faint stars visible to the naked eye from north-central China.
Modern-day infographics: 18th century to present
By the 18th century, scientists and scholars were already warming to the idea of arranging knowledge visually.
British polymath Joseph Priestley produced what could be the predecessor of today's timeline infographics. It was called a "Chart of Biography," where the lives of about 2,000 historical names are plotted on a timeline. It covered figures from 1200 BC to 1800 AD and organized the historical personalities into six categories.

In the United Kingdom, people often complained about the high cost of wheat and claimed that wages were driving the price up. William Playfair, considered the father of modern-day infographics, wanted to find out if this was true by plotting the price of wheat against labor costs. Playfair's chart revealed that this wasn't true – wages were rising much more slowly than the cost of wheat.
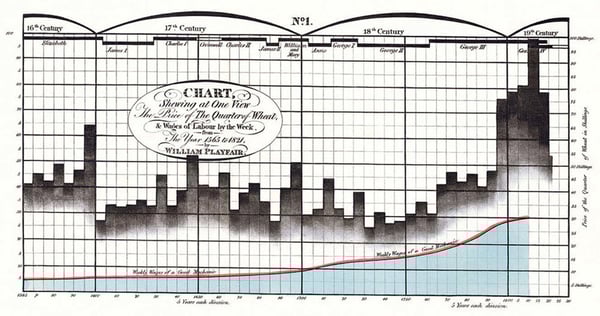
According to psychologist Ian Spence who's writing a biography of Playfair, the father of modern-day infographics was ahead of his time. Playfair made charts because "For him, data should speak to the eyes and that the eye they were the best judge of proportion, being able to estimate it with more quickness and accuracy than any other of our organs."
Excellent data visualization, Playfair argued, "produces form and shape to a number of separate ideas, which are otherwise abstract and unconnected."
Playfair later published The Commercial and Political Atlas , which featured line graphs, bar charts, and histograms representing the England economy. In 1801, he followed this up with the first pie chart.
Baron Charles Dupin invented the choropleth map. A choropleth map has areas that are shaded or patterned in proportion to a statistical variable that represents an aggregate summary of a geographic characteristic within each region, such as population density or per-capita income.
Data based social science was born In France, a lawyer named André-Michel Guerry created maps showing "moral statistics”. He was among the first to use maps with shadings to highlight data - say darker where illiteracy or crime was higher.
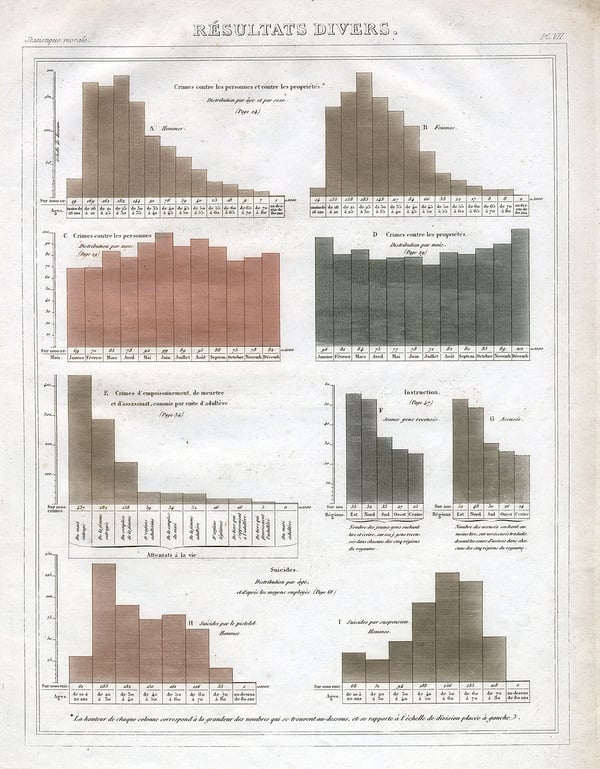
His work was controversial because it challenged conventional wisdom around that time. Social critics in France used to believe that illiteracy led to crime, but the lawyer's maps suggested otherwise.
While the physician John Snow mapped out cholera incidences when it hit London, he noticed a large cluster around the water pump on Broad Street. His visualization helped convince the skeptical city council to close the area around the pump. The epidemic subsided, and Snow's map helped nudge forward a crucial idea – diseases are caused by contact with an as-yet-unknown contagion (bacteria).
English nurse Florence Nightingale used a coxcomb chart (a combination of stacked bar and pie charts) to persuade Queen Victoria to improve conditions in military hospitals. Her graphic highlighted the number and causes of deaths during each month of the Crimean War: blue for preventable diseases in blue, red for wounds, and black for other causes.
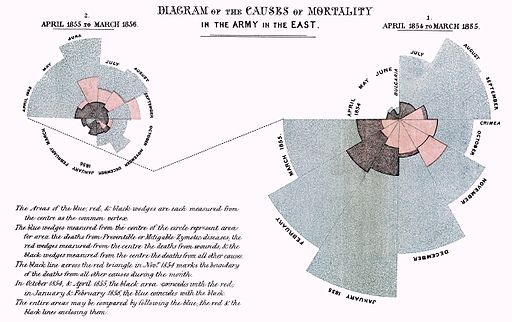
The U.S. Coast Survey published a map showing the distribution of slaves in the southern states of the United States. The map drove President Abraham Lincoln's attention to where slavery was weakest.
Charles Joseph Minard (a French engineer), known for his representation of numerical data on maps, created a map of Napoleon Bonaparte's Russian campaign of 1812.
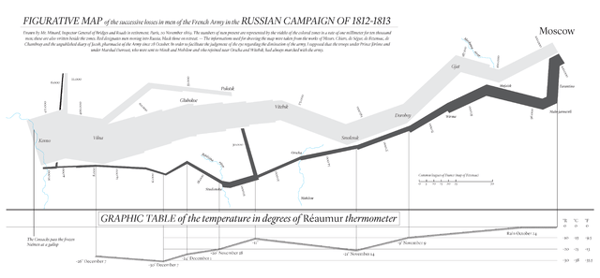
Harry Beck designed the first map of the London Tube. It showed lines to depict public transit routes and stations. This was a milestone in infographics graphics since it showed that visual diagrams could be used for everyday life.
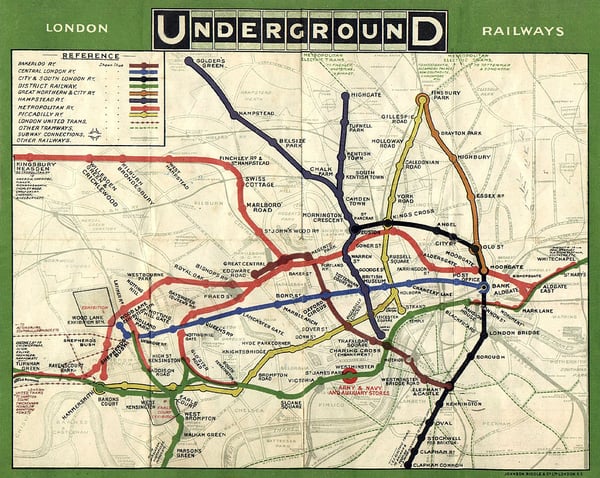
Otl Aicher designed a set of pictograms for the Munich Olympics. Aicher's stylized human figures inspired today's public signs and generic stick figures.

NASA decided that an infographic would be the best way to send a message to extraterrestrials if they exist.
Aluminum plaques with pictorial messages were placed aboard the Pioneer 10 and 11 spacecraft. Each plaque contains simple illustrations of a nude human male and female, as well as symbols designed to indicate the solar system's position in the galaxy.
1975 onward
Edward Tufte , considered the father of data visualization, developed a seminar on statistical graphics alongside John Tukey, another pioneer in the field of information design. Tufte later self-published The Visual Display of Quantitative Information in 1983.
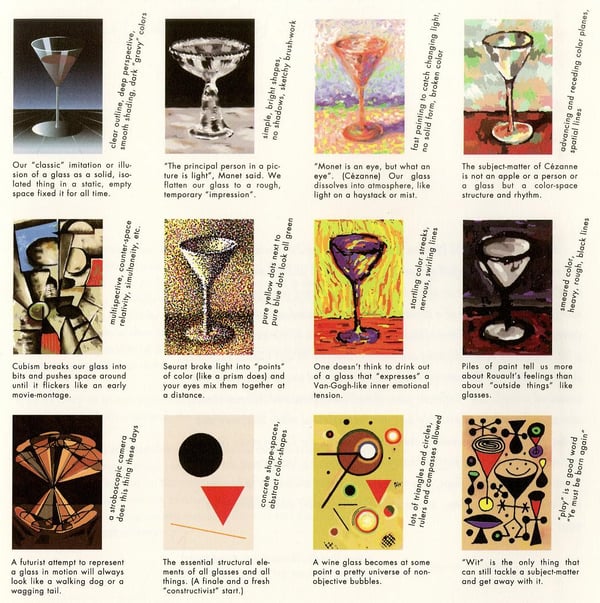
Tufte argues that chart junk or any visual elements that do not communicate specific information are superfluous and should be omitted. He further discourages the use of decorative elements in an infographic.
Tufte also developed the data-ink ratio, which is a measurement of the amount of information communicated in a graphic as it relates to the total number of visual elements.
1978 onward
British graphic designer Nigel Holmes' work was the complete opposite of Tufte's approach. He supported the heavy use of illustration and decoration to embellish information.

Peter Sullivan, a British graphic designer who made infographics for The Sunday Times for almost three decades, wrote the book Newspaper Graphics , which remains one of the few books dealing with information graphics in newspapers. In 1993, he continued on the topic in his book Information Graphics in Colour .
Primary infographic use cases in modern times
From the 1990s onwards, the term infographic and information graphics are often used interchangeably.
According to Infographics: The Power of Visual Storytelling , the infographic of modern times uses visual cues to communicate information. The authors further wrote that an infographic doesn't have to contain a certain amount of data, present a certain level of analysis, or possess a certain complexity.
Here's an excerpt from the book:
"Put simply; there is no threshold at which something "becomes" an infographic. An infographic can range from a simple road sign of a man with a shovel that lets you know there is construction ahead, or as complex as a visual analysis of the global economy."
With that said, infographics are some of the most versatile pieces of content out there. Educators use them every day, employees use them for business reports, and marketers create infographics for lead generation . Here are some of the applications of infographics in the world today.
Data visualization
With the tremendous amount of information and content created every day today, getting the attention (and keeping them!) of viewers is a challenge. Using infographics for data science visualization helps address this challenge.
Aside from the appeal of visuals in capturing the audience's attention, infographics also aids in the retention and comprehension of the information presented. Data visualization formats such as pie charts, line charts, and bar graphs are also used within an infographic in presenting trends and patterns.
Next to graphs and charts, maps are also another subset of infographic use today. They are often ideal for geographical information or political data. The most popular is the choropleth map, where areas in the map are shaded with colors. A color scale is often assigned to a specific numerical or categorical data. Cartograms, proportional symbol maps, pinpoint maps, connection maps, and subway maps are other types of maps in an infographic style.
Infographics for business
Engaging visuals can help transform marketing materials and business information to infographics that can help boost employee productivity, streamline processes, and potentially lead to skyrocketing sales or conversions.

From training new employees with complex written manuals to showcasing a specific product to prospects and investors, using infographics for your business is a game-changer for brands of all sizes.
Infographics for education
Why are infographics effective in the classroom (physical or virtual)? Research from 2015 on using visual aids like infographics in the classroom found out that it helps students in the following areas:
- Increase students’ motivation to learn
- Clarify educational content
- Enhance student vocabulary
- Less time for teachers to prepare lesson plans
- Reduce dullness inside the classroom
- Stimulate learning through direct experience
Moving forward: the future of infographics
As people become more fluent in presenting and understanding data, it's not uncommon to see more advanced types of infographics like animated infographics (also known as gifographics) and interactive infographics.
For the authors of Infographics: The Power of Visual Storytelling , three trends will help share the future of infographics:
- Democratized access to infographic creation tools. People are creating more infographics while using these tools for business, school, and even journalism.
- Socially generative visualization. This approach allows a viewer to interact with the infographic content by adding more data to the existing infographic. In a nutshell, an infographic has perpetual relevance because it's always updated.
- Problem-solving. Data visualization can empower organizations to gather and analyze data to make a lasting, meaningful impact.
In sum, it looks like infographics are here to stay. However, infographic creators need to understand that high-quality, relevant infographics are often a result of original thinking and creativity.

Kai Tomboc is an experienced content designer and writer on all things healthcare, design, and SaaS. She used to be a nurse and a telemarketer in her past lives. She lives for mountain trips, lap swimming, books, and conversations over beer.

There’s no doubt about it: graphic designer’s resumes can look awesome.

Kids are crazy.

Standing out from the crowd is a great feeling.
Never miss a post.
Subscribe to keep your fingers on the tech pulse.
By submitting this form, you are agreeing to receive marketing communications from G2.
Infographics Inspiration
30 timeline infographic examples for your inspiration, by iveta pavlova.
2 years ago
You may also like Show related articles Hide
Infographics are not new, we all did bar graphs, pie charts and timelines throughout school, often with tedious regularity. We know how useful they are in providing visual representations of information quickly and clearly. We can see the patterns and trends at an instant. What is new is the cool way in which these infographics can add style to your data. Our collection of timeline infographic examples will show you some of the techniques the best designers are using and hopefully inspire you to create your own.
1. Is It Time To Trash Your Makeup?
This timeline uses a simple style varying the traditional straight line by regular curves. This keeps the organization clear and allows full use of the page. Consistent typography and color add to the look, with a pink handwritten font for the times, and black standard fonts for the products. Simple and effective.

Is it Time to Trash Your Makeup?
2. The Evolution of Video Games Timeline Infographic
This timeline takes you on a tour of the history of gaming via a lookalike classic Mario game. The ladder takes you through the overall data and splits the graphic to keep a clear separation of key events. Each decade comes on a new stage in the game through color, and each event matches perfectly with an appropriate icon.
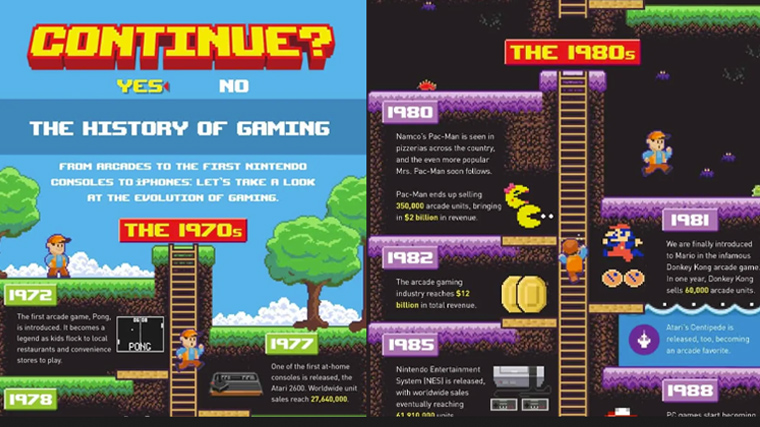
The Evolution Of Video Games In One Epic Timeline
3. Elon Musk Timeline
Another timeline sweeping you chronologically down the page leads you through the life of Elon Musk. The infographic opens with a circular timeline around a stylized image of Musk himself, representing the circle of life. Below we start the journey and experience it through effective vector icons at each major event and a bullet point legend of the 3 key categories, decisions, circumstances, and results.
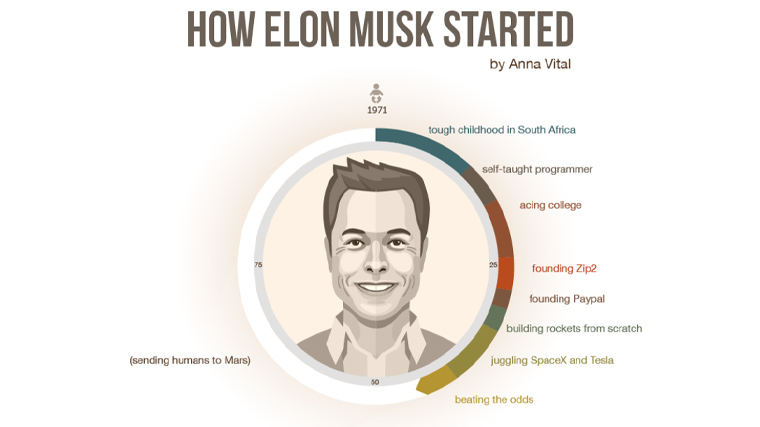
A Timeline Of Elon Musk’s Race To Greatness
4. The Life and Times of Steve Jobs
The life of Steve Jobs in an infographic starts alongside a full-length caricature of the man himself. His lookback uses a double timeline of yellow for his life and blue for his work. Both lines run side by side taking the same timescale with the information in speech bubbles working outwards from the central lines.
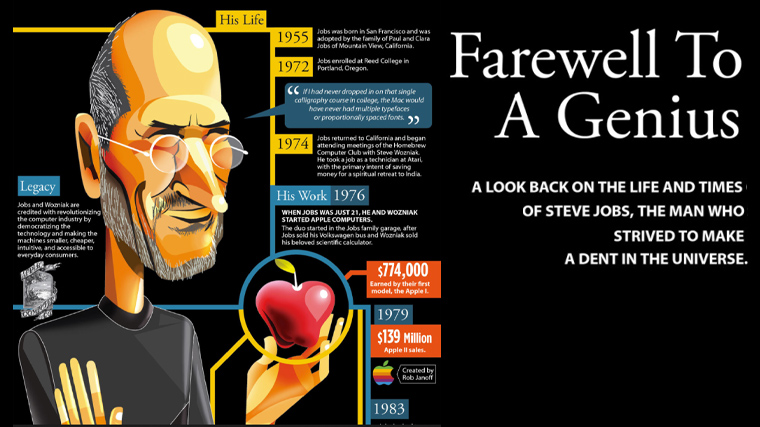
The Life and Times of Steve Jobs
5. Why You Don’t Need a Traditional Job
An infographic about potential opportunities in the gig economy and the appropriate apps to use. The graphic is split into two by a wavy central band with simple icons and a bold heading to specify key areas of possible income. Along with each band are app icons, accompanied by the name.
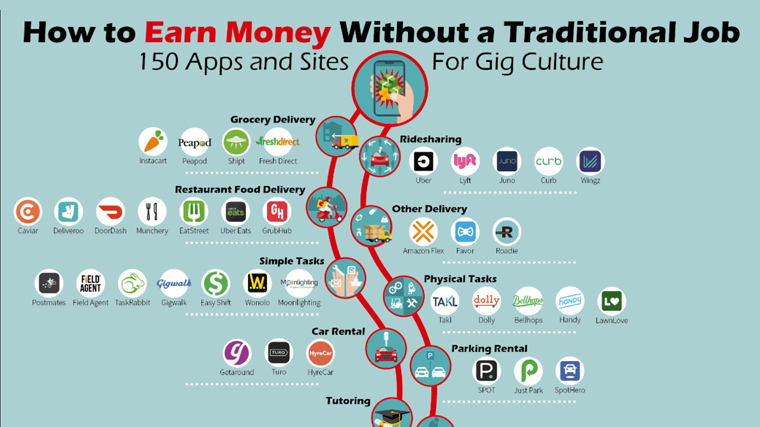
Why You Don’t Need A Traditional Job To Make Money
6. How Sitting Can Harm Your Productivity
A guide to good posture. We get the immediate feeling that this graphic has scientific rigor. To emphasize this each individual issue is also illustrated with clear text and in diagram form.

How Sitting Can Actually Harm Your Productivity
7. 100 Year of Halloween Candy Timeline Infographic
An interesting reworking of the timeline theme. The timeline here moves from left to right along the top of the graphic with the main types of candy running vertically down the left side. Each candy is color coordinated via a legend at the top. This gives the viewer chance to skim down to the candy of choice rather than working through the whole list.
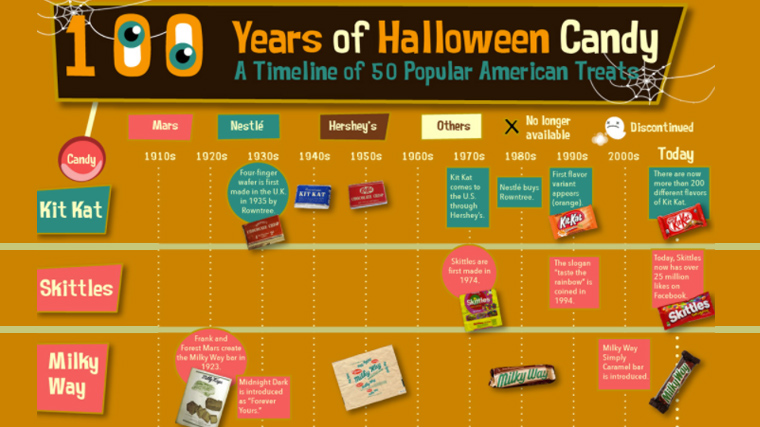
100 Years of Halloween Candy: Fun Facts About Fun Treats
8. Movie Reboot and Remake Revolution
Similarly to the Halloween Candy infographic is this reboot and remake film piece. Again a quick skim down the left allows you to find the films. A clearly dated colored legend furnishes the details. The dark background with brightly colored dates focuses the eye on the important information.
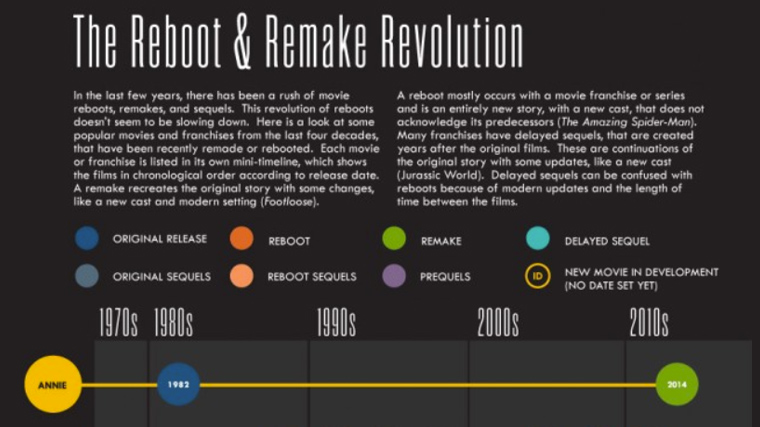
The Movie Reboot and Remake Revolution
9. Easy Ways To Keep Client Projects On Track
This project management guide splits into 5 clear sections with bullets on a soft green background. Presumably, this is the color you’ll feel if you follow the process. Straight lines illustrate the smooth running expected. The feel is business-like, the tone is detailed and the overall effect is that everything is in hand.
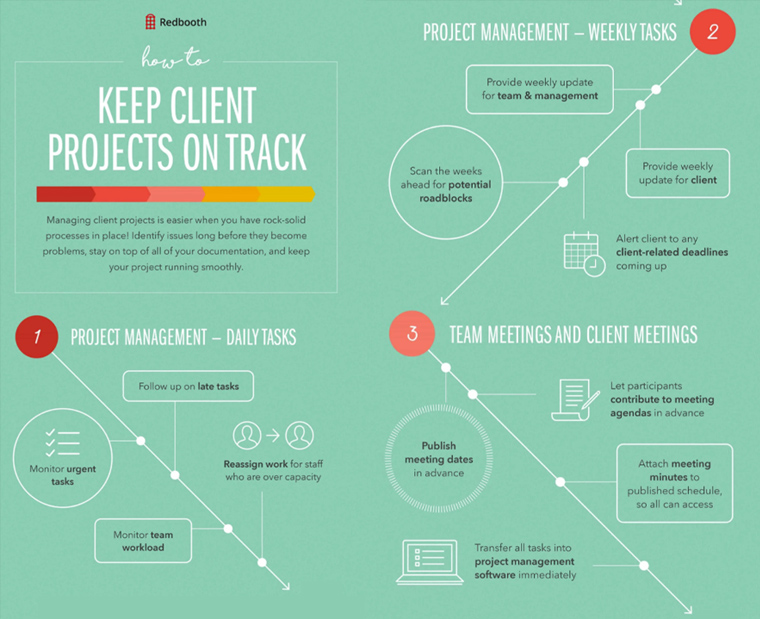
Easy Ways To Keep Client Projects On Track
10. Hospital Muñiz Timeline Timeline Infographic
This graphic by Florencia Souto illustrates a timeline of diseases. Here the genius is the consistency of the medical theme that uses an ECG line to bring you from the 1800s to the present day. Added to this is the sparing use of color with red and black on a white background. A great piece of design.
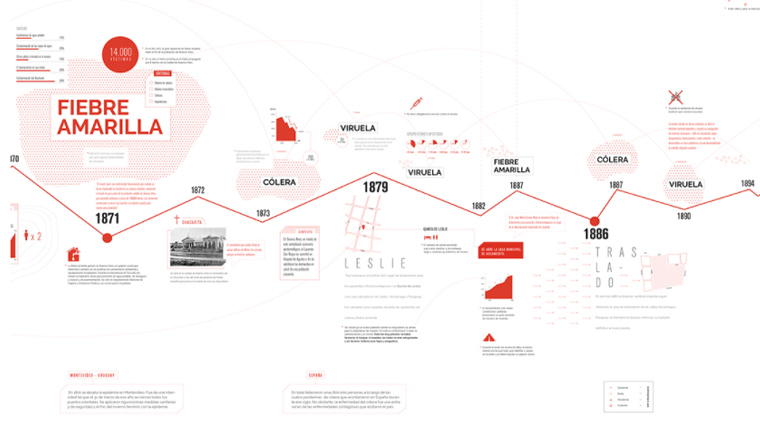
Linea de tiempo Hospital Muñiz by Florencia Souto
11. My Creative Process Timeline Infographic
The designer used vector illustrations to create a timeline of their designing process in their first semester in university. The result is very neat and easy to read.

Wanderlust: My Creative Process Timeline Infographic by Drishti Khemani
12. Evolution of Business
Here we can see how clever use of space and illustration can make an infographic stand out from the crowd. The timeline itself is straightforward enough but the area of blank space to the side of the information gives us time to breathe. Stylish comic illustrations visualize key areas.
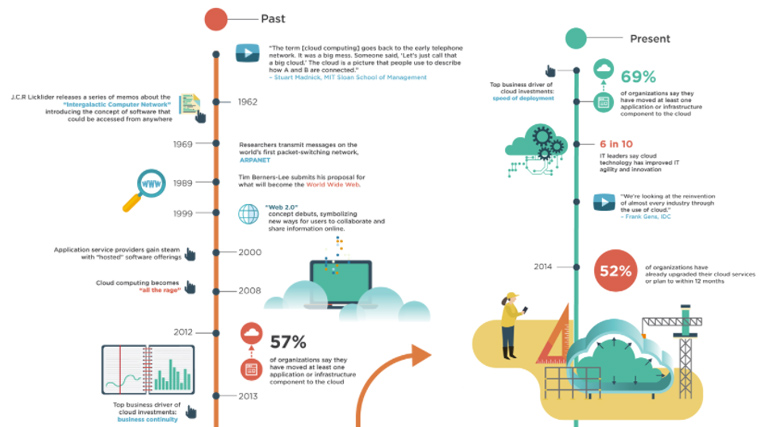
Evolution Of Business And The Cloud Timeline Infographic Example by Mazakii
13. History Of Life Timeline Infographic
This circular timeline infographic illustrates the history of life as we know it from the formation of the continents and the very first lifeforms on earth through all milestones till the present day. The heavy data looks way simpler and easy to read thanks to the great structure.
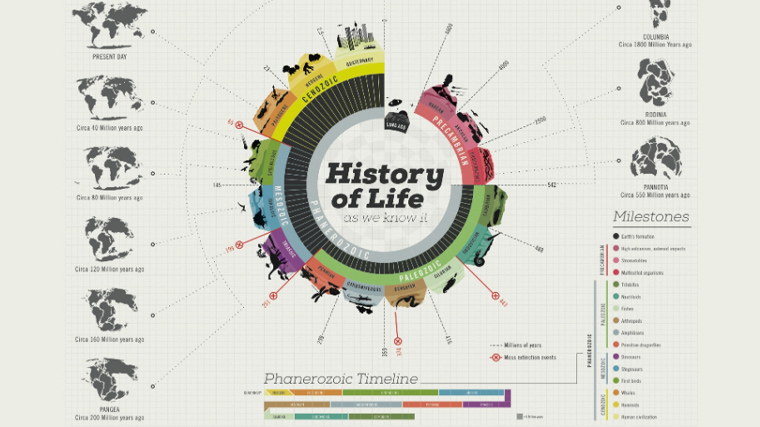
History of Life Circular Timeline Infographic Example by Juan Martinez
14. Future According To SciFi
This infographic takes us on a journey to the future according to science fiction. A dark blue background recognizes the input of space in many of these films and series. All characters from these shows are illustrated in a consistent style. Immediately recognizable visualization.
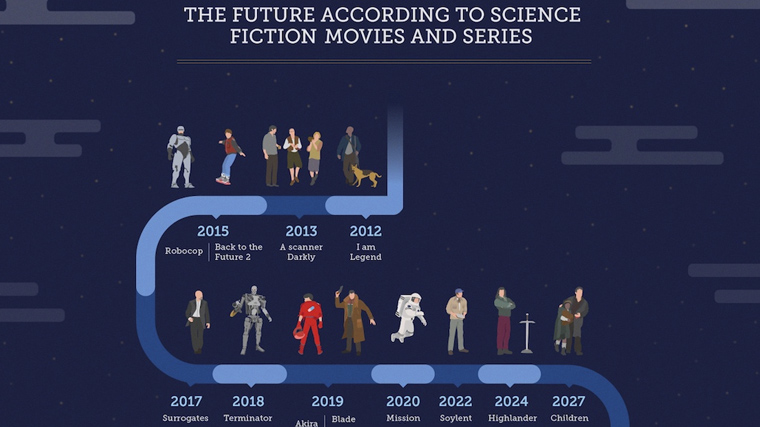
The Future According To Science Fiction Timeline Infographic by Zamir Bermeo
15. Personal Timeline
This abstract form of a timeline infographic shows the personal story of faith and the growth of a man on his path to becoming a designer. The geometric imagery and soft gradient lighting are simply mesmerizing.

An Abstract Personal Timeline by Daniel Patrick
16. A History of Western Typefaces Timeline Infographic
This infographic relies on shapes and beautifully selected and combined fonts .
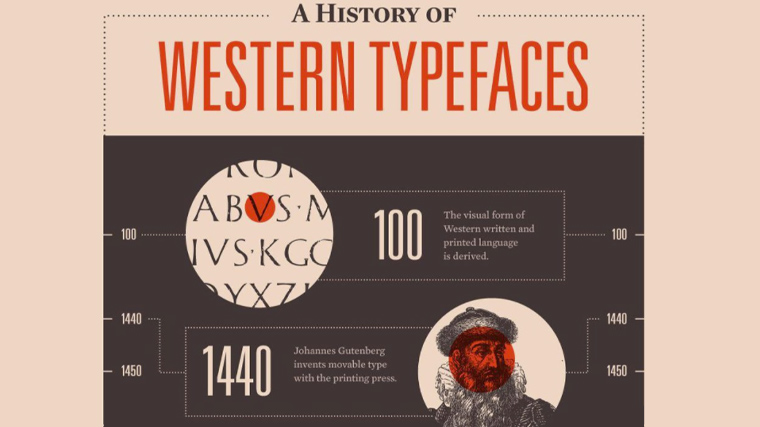
A History of Western Typefaces Timeline Infographic Example by Nick Sigler
17. The History of The Turntable ???
This history of turntables uses shades of blue to grab us. Classic illustrations of different record players are all stylized, the blue tones giving them a certain ghostly quality, intriguing you. The pictures take you to the time, and then the details are there for you.
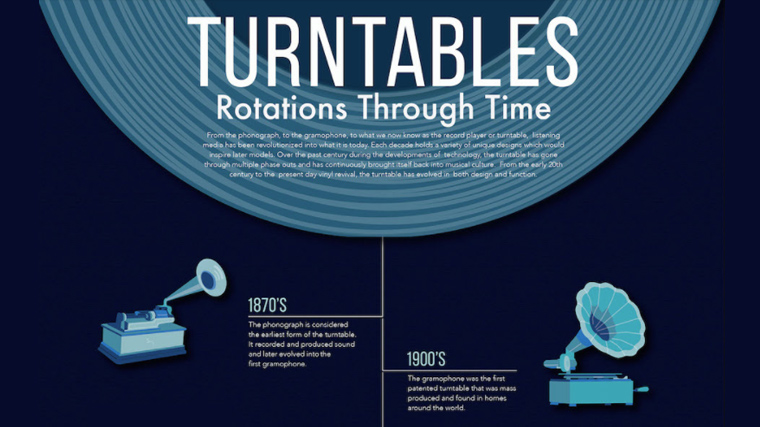
The History of The Turntable Timeline Infographic Example by Natalie Kidd
18. Evolution of Home Audio Timeline Infographic
This history of home audio systems is brought to life with black and white photos symbolically depicting key events. The decidedly aged washed grey background lets the photos take center stage and each is labeled with a contrasting bold red year, popping out of the page.
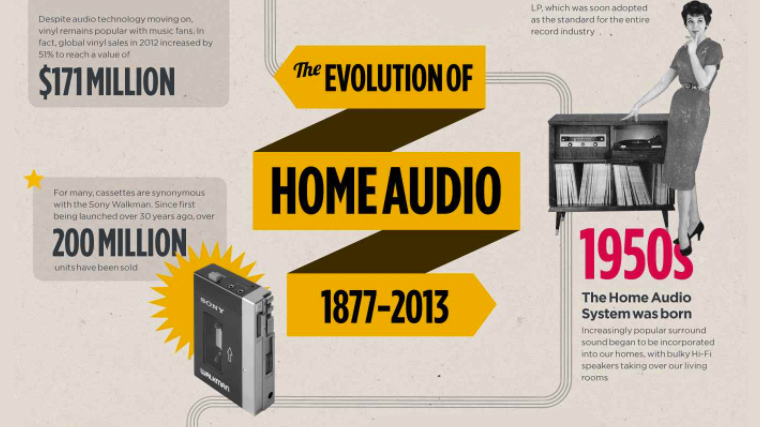
The Evolution Of Home Audio Timeline by Logitech
19. Creative People Timeline Infographic
Here is an example of how humor can work well in these kinds of infographics. Each part of the day is accompanied by a cartoon illustration of the central character. Here we can also see great use of background color gradual shading from the pink of the early morning sunrise to the darker purple of the evening.

Creative People
20. Police Sunglasses
This timeline of sunglasses uses fashion magazine shots and setouts in the columns of these publications. It reads like a newspaper article, with the dates breaking the page like headlines. Very cool indeed.
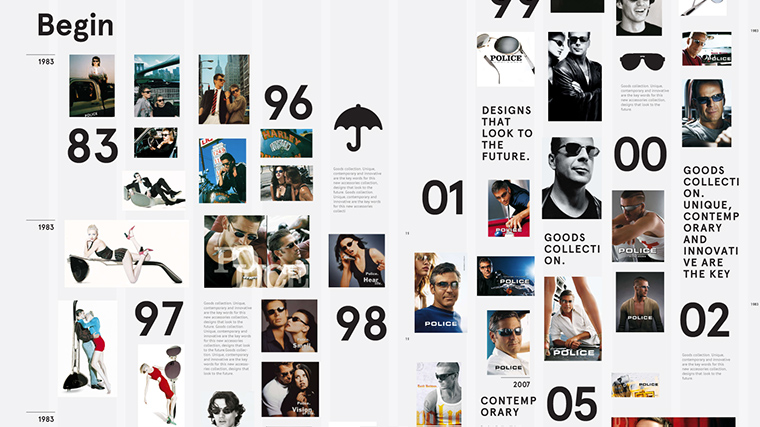
Police Sunglasses Interactive by Yuri Narvin
21. History of Skype Timeline Infographic
This history of Skype lays on a cloud against a sky in the signature skype blue. The timeline curves go from 2003 to the present day in a repeated skype blue S pattern. Branding is clear throughout.
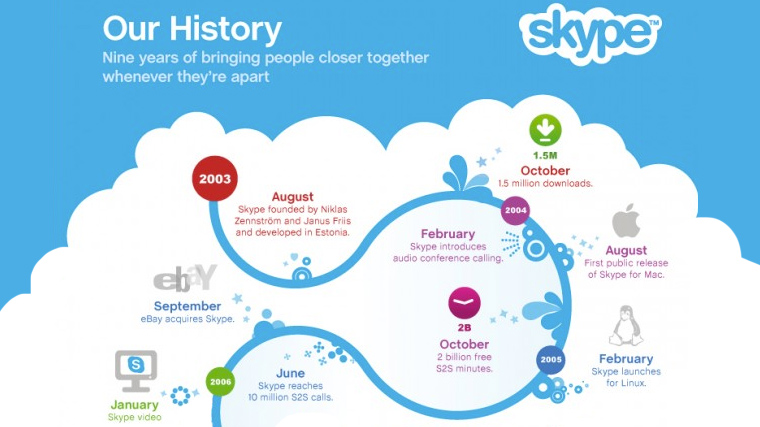
History of Skype
22. Evolution of the Internet and Technology
Here’s a gorgeous retro look for this educational infographic about the evolution of the internet & technology. Strong geometric shapes and colors, straight direct lines, and classic retro font. Each point is illustrated with a very simple vector icon. Cool in its simplicity.
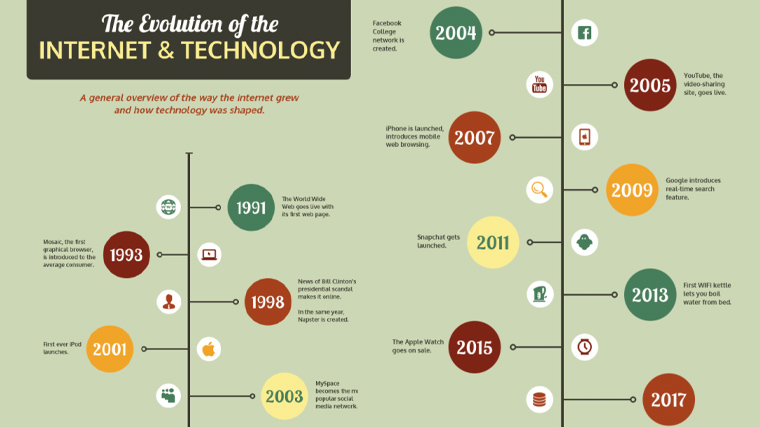
Retro Timeline Infographic
23. Evolution of The Camera
The evolution of the camera is brought to us with the help of some very cool icons which simply punch out of the page.
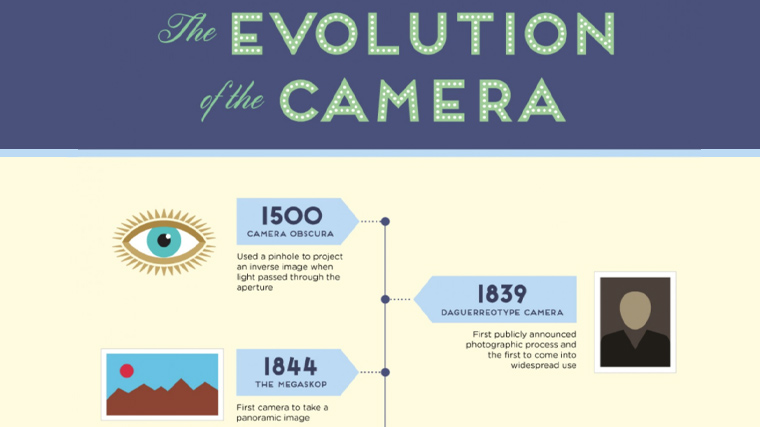
The Evolution of the Camera by Cyrus
24. History of Israel Timeline Infographic
The history of Israel is made to look like a retro computer game adventure. The timeline road cuts through the desert, with heavily pixelated characters and scenes. Each historical era is also given a bright yellow symbol signifying its religious leanings. Simple yet beautiful.
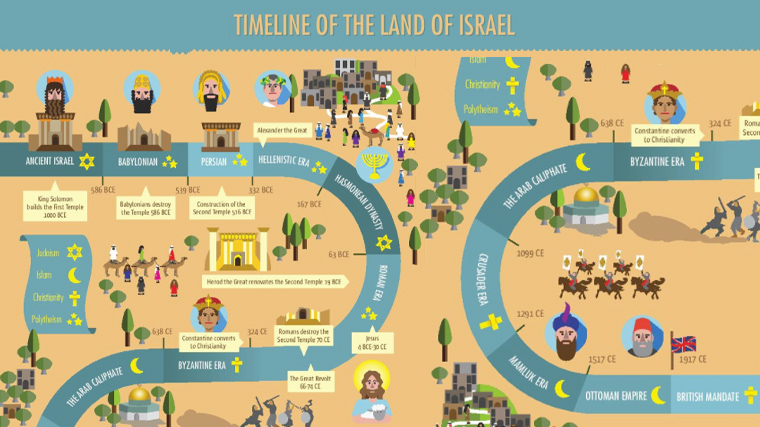
Timeline of the Land of Israel
25. Caloi Expo
This timeline uses a collage of beautifully retouched images, high-contrast colors and shapes, and patterns that finalize the design.
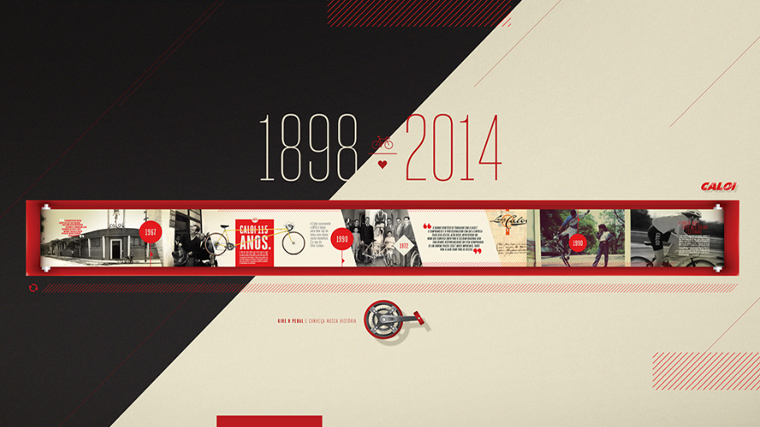
Expo – Caloi by Diego Aguilar
26. 24-Hour
On September 5th, 2015, Paul Lee had a fairly productive day and it’s all there in the 24-hours timeline that uses color gradients to nail the time of the day and night.
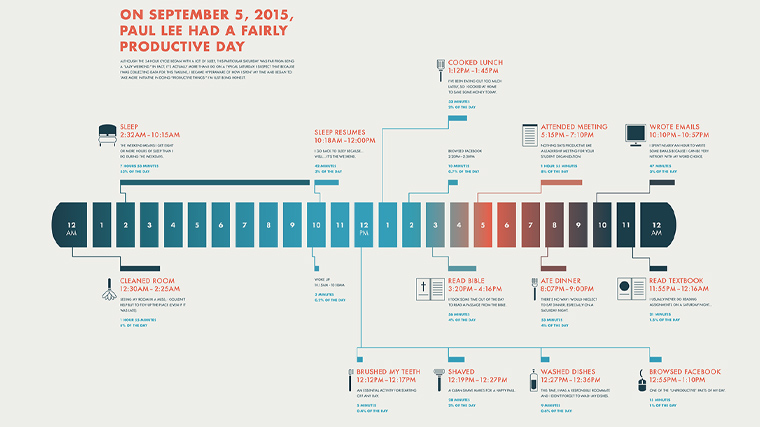
24-hour Timeline || Infographic by Paul H. Lee
27. Self-Promotion Design Timeline Infographic
In this infographic, the designer Chen-Wen Liang showcases her graphic design skills through a masterfully-crafted futuristic timeline. The design is smooth, clear, and combines colors well.
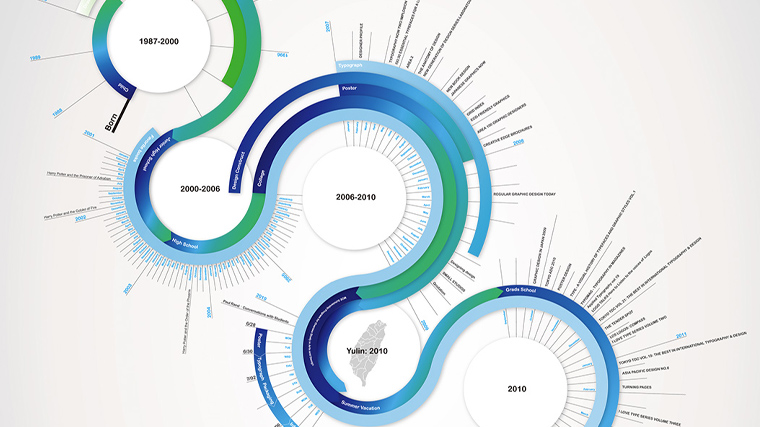
Infographic Design by Chen-Wen Liang
28. Interstellar Timeline
In case you found it difficult to follow the timelines in the movie Interstellar, Dogan Can Gundogdu has you covered. This futuristic imagery is well combined with simple almost silhouette-like graphics and explains the plot in a very creative way.
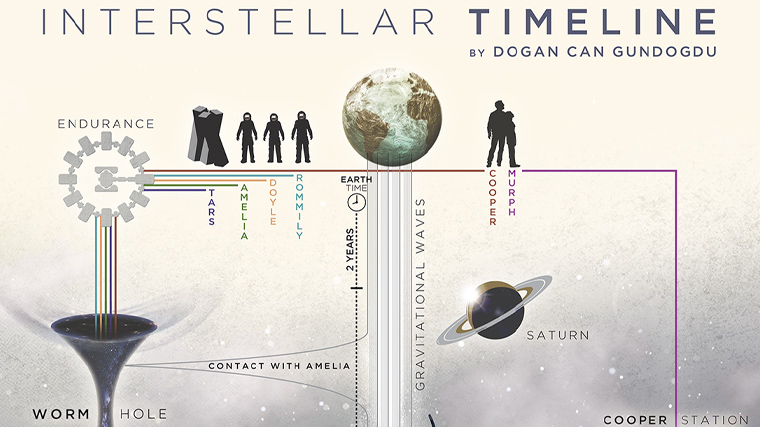
Interstellar – Timeline – Artwork by Dogan Can Gundogdu
29. Ray Bradbury Timeline
Another futuristic design, this time uses the divine ration to organize the data. The overall feeling is of a space map.
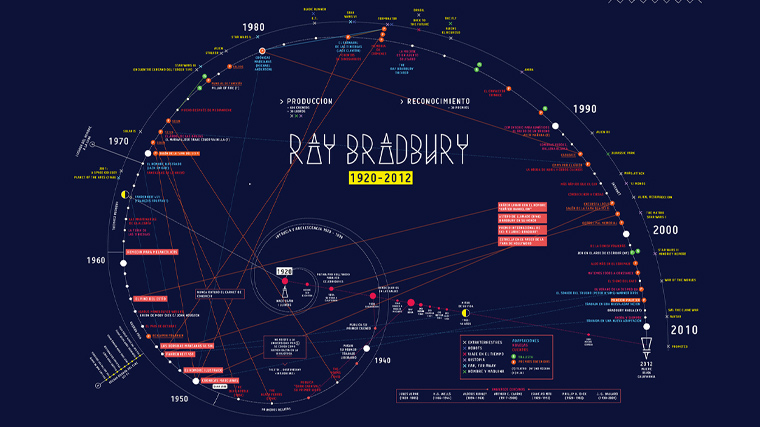
Ray Bradbury Timeline by Ailim Melillan
30. The History of Light
And last, but not least, here’s a fun little infographic dedicated to the history of light. The graphic uses lovely flat illustrations and small text boxes with facts. Simple, creative, and lovely.
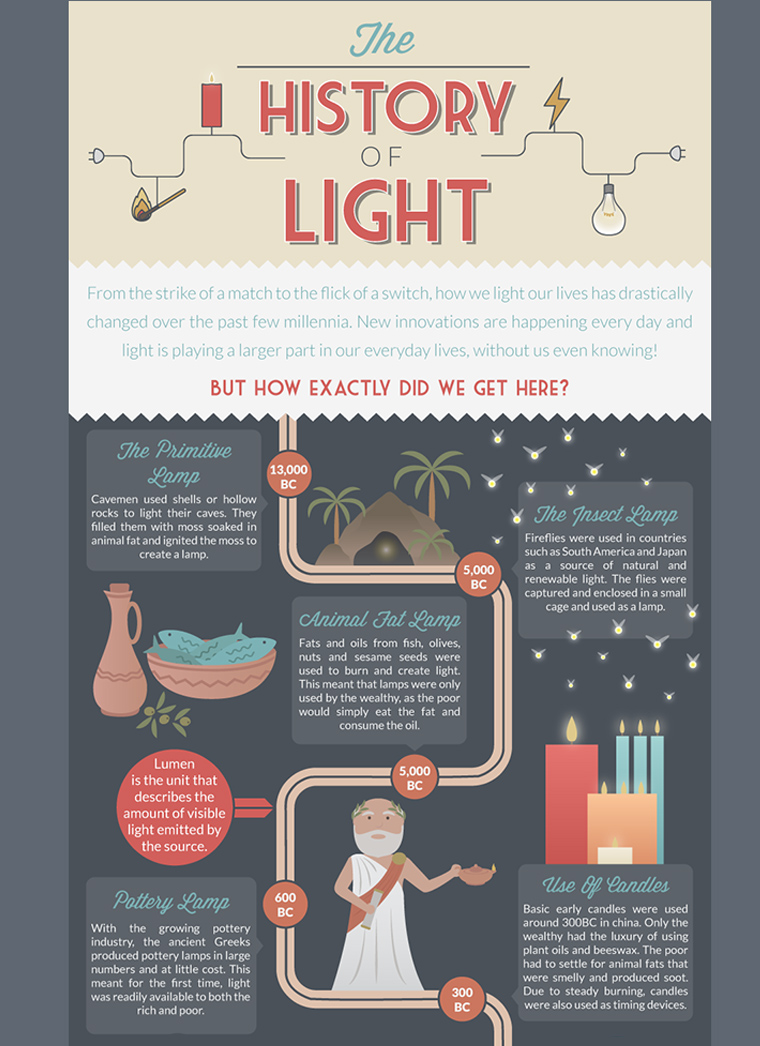
‘History of Light’ infographic by Rowena Leanne
Final Words
We hope this collection of timeline infographic examples inspired you. The common theme is the ability to enable the viewer to visualize often complex information in a simple way while experimenting with creative design and color. The designs add to rather than dominate the information and give the reader access to the story with ease. Timelines don’t have to be boring, and these examples certainly prove there is life in the old techniques yet.
In the meantime, why not check another inspirational gallery on the topic, such as these awesome 28 Infographic examples .
Share this article

Iveta is a passionate writer at GraphicMama who has been writing for the brand ever since the blog was launched. She keeps her focus on inspiring people and giving insight on topics like graphic design, illustrations, education, business, marketing, and more.
You may also like ...
20 Really Good PowerPoint Examples to Inspire Your Next Presentation 20 Really Good PowerPoint Examples to Inspire Your Next Presentation
By Sandra Boicheva

Website Examples
19 creative artist websites that will amaze you 19 creative artist websites that will amaze you.
By Ludmil Enchev

Graphic Design Inspiration
30 really good display ad designs in the wild 30 really good display ad designs in the wild.

Thailand Travel Timeline Infographic

IMAGES
VIDEO
COMMENTS
Today, trips like these are often within reach of the average American family. But that's a relatively new development. In a paper for The Journal of Economic History, Thomas Weiss explains how tourism went from an uncommon pastime for elites to a thoroughly middle-class activity. Weiss writes that, in general, the first European settlers in ...
tourism, the act and process of spending time away from home in pursuit of recreation, relaxation, and pleasure, while making use of the commercial provision of services. As such, tourism is a product of modern social arrangements, beginning in western Europe in the 17th century, although it has antecedents in Classical antiquity.
Events within 1996-2000. Mussolini Timeline. Mussolini Timeline. GEI | Iran Revolution 2023. America Pre-State (hnstly it's just me studying so don't click lol) Alaska Alive! Formation of the european union. The Progressive Era 1900-1920. Mussolini and Fascist Italy.
Conclusion. The travel industry has become a combination of DIY internet tools and travel management companies. Transportation innovations such as trains and airplanes have eliminated the problems and lowered travel costs. In short, it has become possible for travelers to go anywhere on the globe in less than 48 hours.
Evolution of Hospitality. The evolution of hospitality has developed alongside the growth of travel and tourism for leisure. The more people are able to find the time and the money to travel, the ...
The History of Tourism. The history of tourism is rich and extensive and has undergone many changes and evolutions. For thousands of years, people have been moving from place to place for one ...
Main Body. Chapter 1. History and Overview. Learning Objectives. Specify the commonly understood definitions of tourism and tourist. Classify tourism into distinct industry groups using North American Industry Classification Standards (NAICS) Define hospitality. Gain knowledge about the origins of the tourism industry.
The our break of war in 1940s caused travel to become dangerous again. The Roman Empire built more than 80 000km of roads throughout Europe. Making it much easier access to the different areas. This made traveling much more convenient for everyone. For the first time in history, travel was easy and safe for everyone.
Abstract. The aim of the present book is to provide an overview of tourism evolution in the past, present and future. This book discusses significant travel, tourism and hospitality events while ...
History of Tourism. May 3, 2021 •. 4 likes • 15,556 views. Cris dela Peña. Follow. This chapter tackles about the historical milestones of the tourism industry. It also discusses the important historical events in the development of tourism in the Philippines. Read more.
In the last decades of the 19th century, the upper social classes in England were so wealthy due to the income from the British Empire that they were the first to be able to afford trips to far-flung areas. (1) In 1854, the first travel agency opened. In 1869, one of the first group tours was launched. It included attendance at the opening of ...
Submitted by Sara Ghasemian on Thu, 06/29/2023 - 17:14. This timeline showcases the chronological progression of technological advancements in the tourism industry. It provides a visual representation of key milestones and shifts in technology that have shaped the industry. Research Question: How have technological innovations influenced the ...
According to the United Nations World Tourism Organization (UNWTO), international tourist arrivals reached 66 percent of 2019 levels in 2022, up from 28 and 30 percent, respectively, in 2020 and ...
Development of the cruise industry. History of Dance. Kagerou Project Release Timeline. GWCA, Inc. "Lifting As We Climb". Yellow Labs Software Inc. History. Barbados Water Authority. Fulgencio Batista to 1941. U11 Cyber Security. Cincinnati's Affordable Housing Trust Fund.
A well-conceptualized infographic presents a call to action for people to follow as well. Because of its visual impact, it's easy to share online, too. Discover clever ideas for travel infographics on Canva. Find ways to incorporate pointers for responsible tourism within the usual destination travel guide and list of travel hacks.
Free Download. 7. Hand-Drawn Style Infographic Timeline Template - Light. If you are looking for more simple illustrations, these hand-drawn, organic, pastel shapes are a great addition to your designs. This free infographic resembles a tree - don't forget that 2021 is the year of design with natural elements.
Timeline infographics are powerful visual tools that enable the representation of complex information in a clear and concise manner. Whether you want to showcase historical events, project timelines, or any sequence of events, timeline infographics are perfect for presentations, reports, and educational materials.With their ability to engage and inform audiences, infographic timelines have ...
This free tourism timeline infographic template wiil be a nice choice to start creating tourism infographics you need. Business Process Infographic. 13960. 224. Cellphone News Infographic. 12604. 216. Architecture Survey Infographic. 10452. 209. College Life Resolution Infographic. 9900. 198. Protect environment Infographic.
Venngage offers a captivating collection of history infographic templates that breathe life into the past, making historical narratives visually compelling and easily understandable. These templates seamlessly blend design aesthetics with informative content, allowing educators, researchers, and enthusiasts to present complex historical events ...
The 1970s: The Birth of Space Tourism. The 1960s came to a close and the repeatability of human spaceflight was proven. The 1970s began with an idea that perhaps people other than highly-trained astronauts and cosmonauts could able to go to space. This is the first real chapter in the history of space tourism.
Old-time visuals: the beginning of infographics. Infographics can be traced back to the spray-shaped images in the Chauvet-Pont d'Arc Cave in France at around 37,000 BC. They were believed to be painted at around the same time as nearby volcanoes erupted and spewed lava into the sky. Source.
13. History Of Life Timeline Infographic. This circular timeline infographic illustrates the history of life as we know it from the formation of the continents and the very first lifeforms on earth through all milestones till the present day. The heavy data looks way simpler and easy to read thanks to the great structure.
This Thailand travel timeline infographic depicts a brief history of Thai tourism. Tourists are exploring everything Thailand offers, whether it's the stunning beaches or trekking through the lush green jungles in the north. Tourism in Thailand has an undeniably positive economic impact on the country and its people. According to the Authority on World Travel and Tourism, there were ...